
Figure 9.
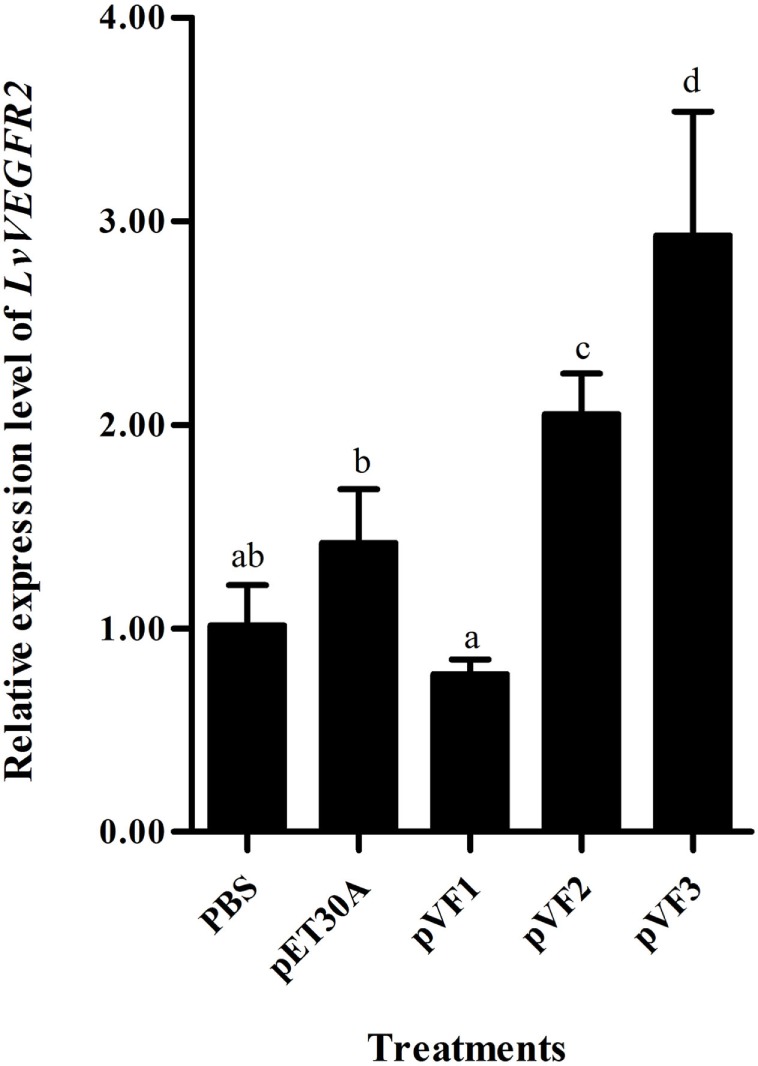
Expression level of LvVEGFR2 in the cephalothorax of shrimp after injection of pVF1, pVF2, and pVF3. PBS, injected with phosphate-buffered saline; pET30A, injected with pET30A protein; pVF1, injected with recombinant LvVEGF1 protein; pVF2, injected with recombinant LvVEGF2 protein; pVF3, injected with recombinant LvVEGF3 protein. Different lowercase letters (a, b, c, and d) show significant differences (P < 0.05) for the gene expression levels between two groups.