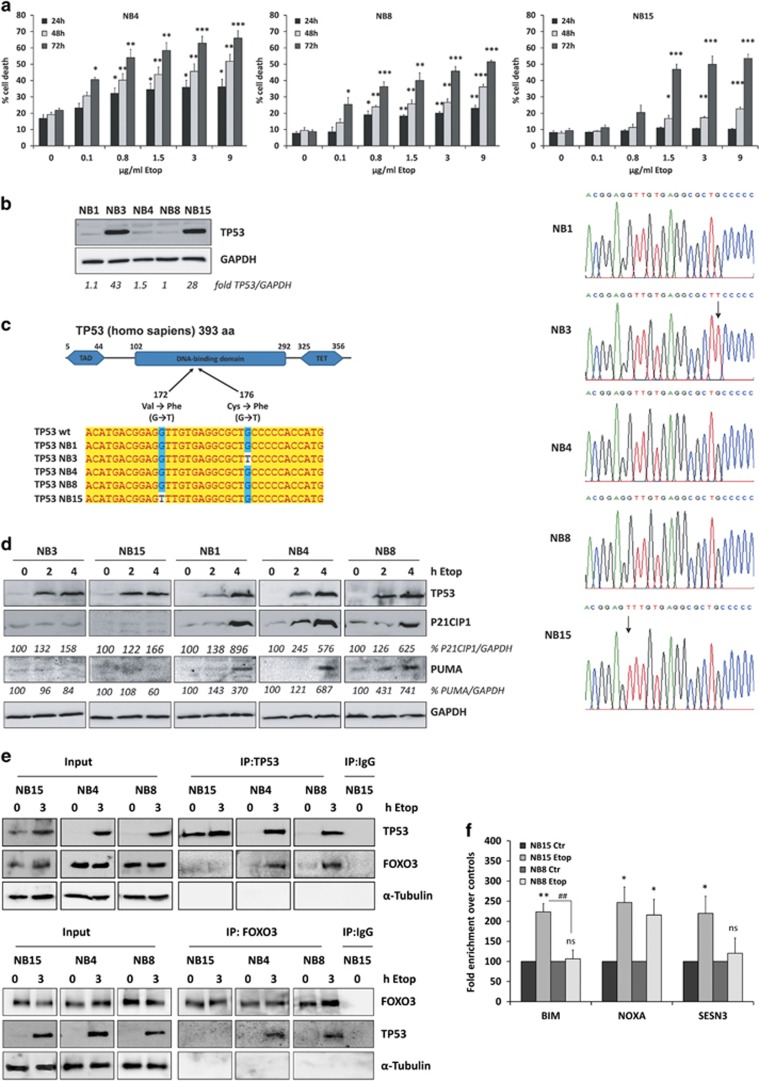
Figure 4.
Binding of TP53 to FOXO3 affects target-gene-transcription in high-stage-derived NB cell lines. (a) NB4, NB8 and NB15 cells were treated with increasing doses of etoposide (0.1–9 μg/ml). Cell death was analyzed by PI-FACS analyses after 24, 48 and 72 h. Shown is the mean±s.e.m of three independent experiments; ***P<0.001, **P<0.01, *P<0.05; significantly different to untreated controls. (b) Cell lysates of NB1, NB3, NB4, NB8 and NB15 cells were subjected to immunoblot analyses for TP53. GAPDH served as loading control. For quantification, the TP53 level of NB8 cells was set as 1. (c) Sanger DNA sequencing of TP53 cDNA from NB1, NB3, NB4, NB8 and NB15 cells. Schematic structure of the TP53 protein (GenBank: NP_000537.3): TAD, transactivation domain; TET, tetramerization domain. Alignment of wild-type TP53 and sequencing data of TP53 cDNA prepared from NB1, NB3, NB4, NB8 and NB15 cells. (d) Cell lysates of NB3, NB15, NB1, NB4 and NB8 cells treated with 10 μg/ml etoposide for 0, 2 and 4 h were analyzed by immunoblot using antibodies against P21CIP1, PUMA and TP53. GAPDH served as loading control. To prevent saturation, a short exposure time for TP53 detection in NB3 and NB15 samples was chosen. Densitometry was performed using Labworks software version 4.5 (UVP, UK). (e) NB15, NB4 and NB8 cells were treated with 10 μg/ml etoposide for 0 and 3 h and subjected to immunoprecipitation using anti-TP53 (upper panel) or anti-FOXO3 (lower panel) as precipitating antibody and precipitates were analyzed by immunoblot using antibodies directed against TP53, FOXO3 and α-Tubulin. IgG (1 μg) was used as negative control. (f) ChIP analyses were performed in NB15 and NB8 cells treated with 10 μg/ml etoposide for 2 h. Binding of FOXO3 to the promoter regions of BIM, NOXA and SESN3 were quantified by quantitative RT–PCR. Shown is the mean value±s.e.m. of three independent experiments, each performed in duplicate. Significantly different to untreated cells: **P<0.01, *P<0.05; significantly different between etoposide-treated cells: ##P<0.01. ChIP, chromatin-immunoprecipitation

