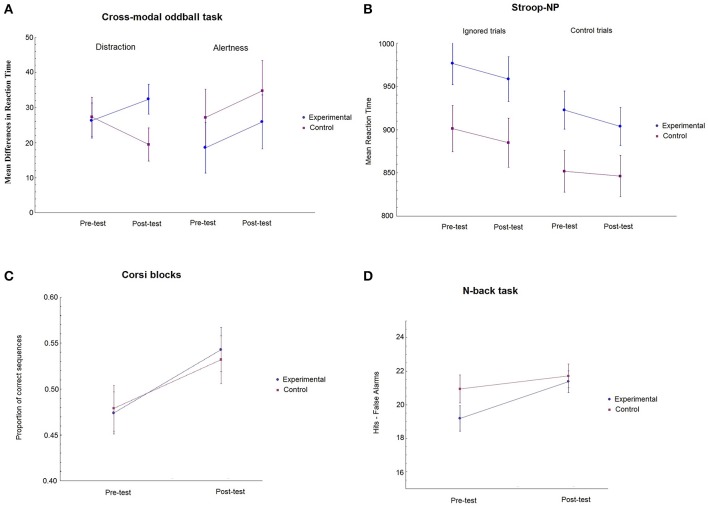
Figure 3.
Mean performance of trained and active control groups at pre-test and post-test. (A) Mean differences between conditions for distraction (novel—standard) and alertness (silence—standard) in ms. (B) Mean RTs for ignored and control trials in the Stroop task. (C) Mean proportion of correct sequences in the Corsi blocks task. (D) Mean hits—false alarms rates obtained in the n-back task. Error bars represent plus minus 1 standard error.

