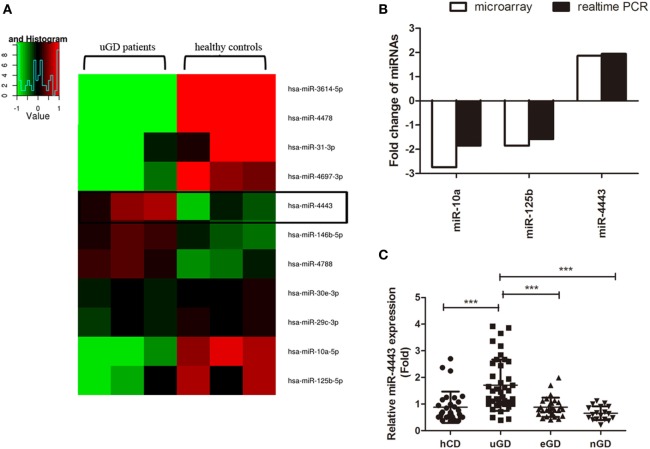
Figure 1.
Increased expression of microRNA (miR)-4443 in CD4+ T cells from untreated Graves’ disease (uGD) patients. (A) Heat map of differentially expressed miRNAs (P < 0.05) in CD4+ T cells from three uGD patients and three healthy control donor (hCD). (B) Differential miR-10a, miR-125b, and miR-44443 expression in CD4+ T cells was verified by real-time polymerase chain reaction (PCR) using a larger GD and control sample. (C) Expression of miR-4443 in CD4+ T cells from healthy controls, uGD patients, euthyroid GD (eGD) patients and TRAb negative-conversion GD (nGD) patients. Bars show the mean ± SD. **P < 0.01; ***P < 0.001.

