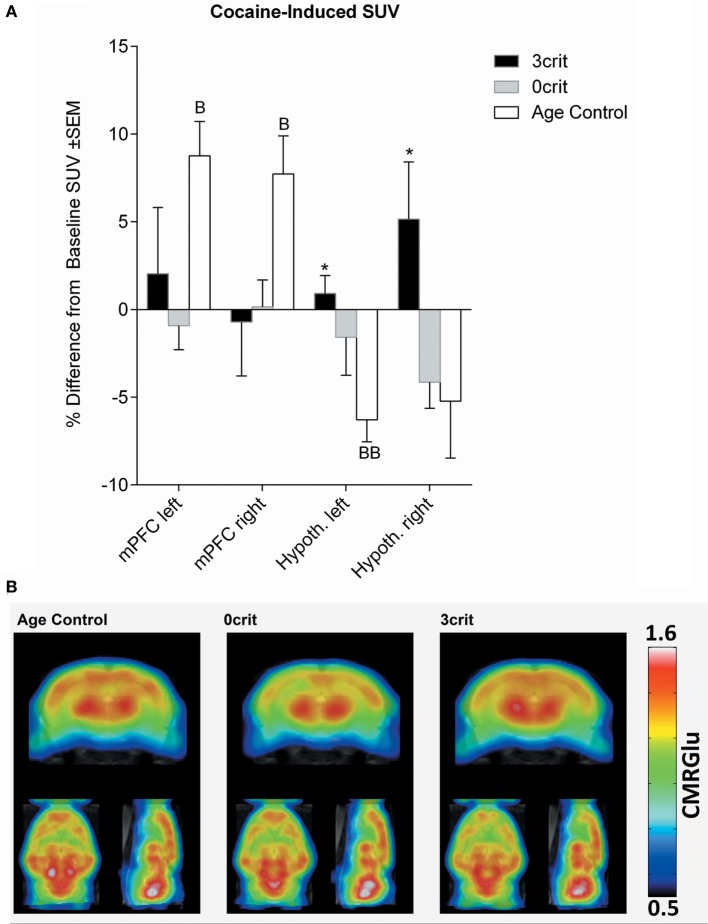
Figure 4.
Regional quantification of metabolic activity after infusion of a cocaine bolus (0.8 mg/kg i.v.). (A) Cocaine-induced SUV expressed as relative difference from baseline (i.e., SUV measured after saline injection). Cocaine increased SUV in the mPFM and decreased it in the hypothalamus of cocaine naïve rats. (B) Metabolic maps representing cocaine-induced cerebral metabolic rate of glucose (CMRGlu) in Age Control, 0crit, and 3crit rats. *p < 0.05 vs Age Control, B p < 0.05 and BB p < 0.01 vs Baseline SUV. mPFC, medial prefrontal cortex; Hypoth, hypothalamus.

