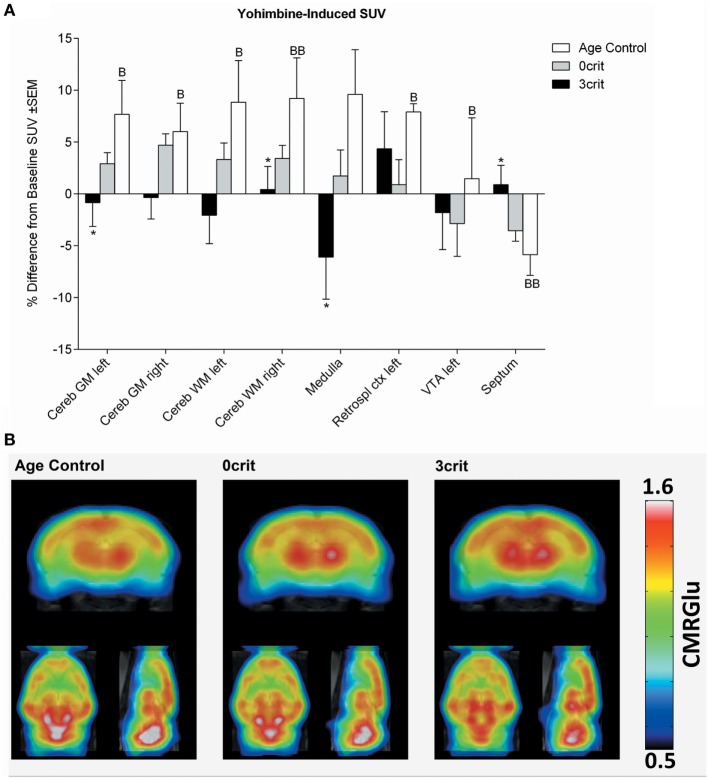
Figure 5.
Regional quantification of metabolic activity after infusion of a yohimbine bolus (0.05 mg/kg i.v.). (A) Yohimbine-induced SUV expressed as relative difference from baseline (i.e., SUV measured after saline injection). Yohimbine increased SUV in several areas and decreased it in the septum of age-matched control rats not trained for cocaine self-administration. (B) Metabolic maps representing yohimbine-induced cerebral metabolic rate of glucose (CMRGlu) in Age Control, 0crit, and 3crit rats. *p < 0.05 vs Age Control, B p < 0.05, and BB p < 0.01 vs Baseline SUV. VTA, ventral tegmental area; Retrospl ctx, retrosplenial cortex; Cereb WM, white matter of cerebellum; Cereb GM, Gray matter of cerebellum.

