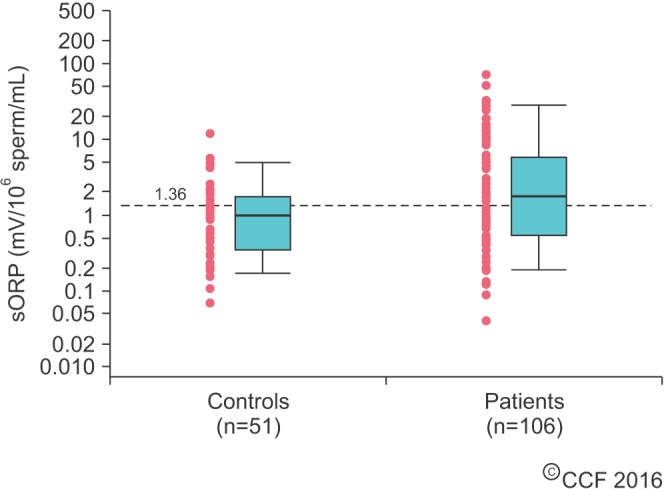
Fig. 4. Distribution of static oxidation-reduction potential (sORP) (mV/106 sperm/mL) in controls and patients showing the established cutoff values. Data are represented as box-plot showing median and interquartile range. The whiskers are the 95% confidence intervals.