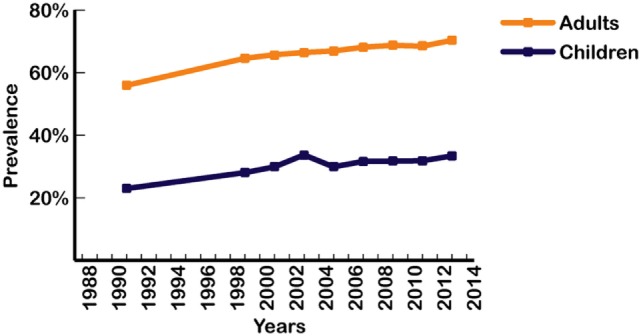
Figure 2.

Prevalence of overweight and obesity in US adults and children from 1988 to 2014 (4, 5). Data points represent the middle year of each interval surveyed for adults and children. Intervals from left to right: 1988–1994; 1999–2000; 2001–2002; 2003–2004; 2005–2006; 2007–2008; 2009–2010; 2011–2012; 2013–2014. Based on crude estimates.
