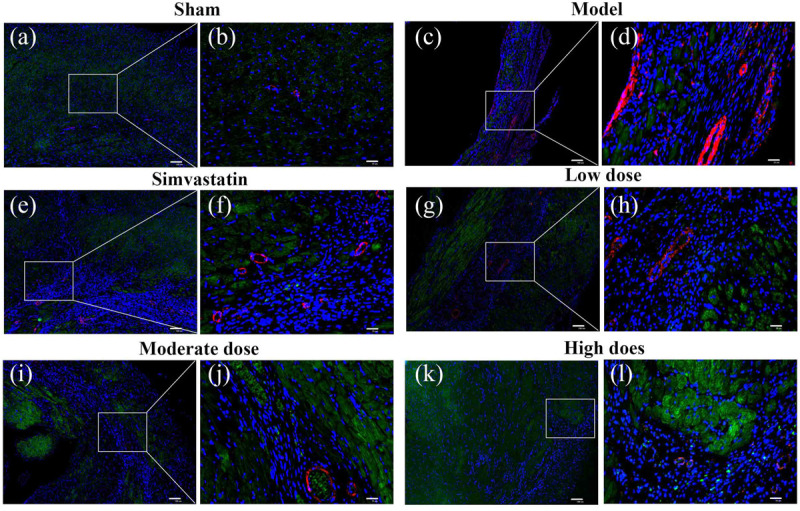
FIGURE 10.

Representative distribution images of ERβ and α-SMA in rats treated with different doses of GXDSF. Immunofluorescence micrographs showing the differences in the distributions of ERβ and α-SMA in the infarct and per-infarct region in all experimental groups (a,c,e,g,i,k). Bars represents 100 μm. The right part of the figures (b,d,f,h,j,l) were augmented at 4-fold in the corresponding (the left) part of figures. In addition, the different quasi-colors were depicted for distinguishing ERβ and α-SMA, in which blue represented nuclei, green represented ERβ and red represented α-SMA.
