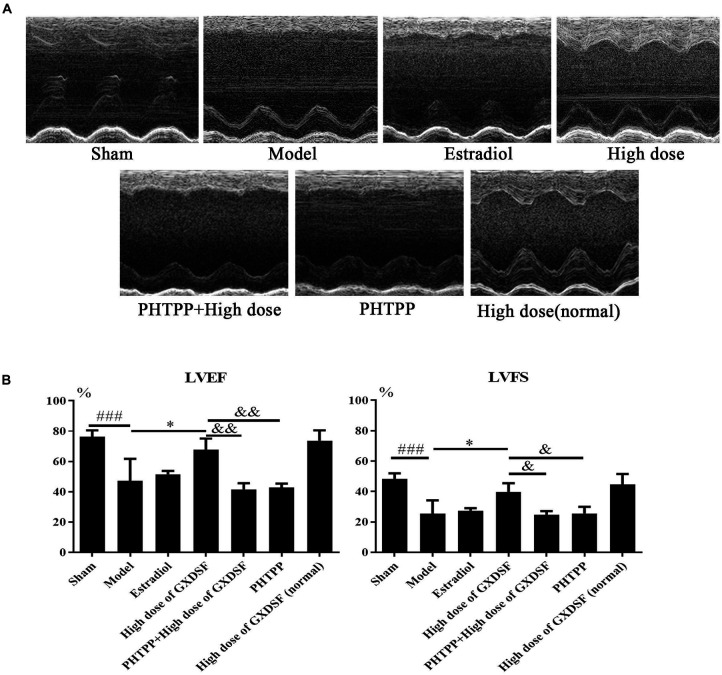
FIGURE 4.
Echocardiogram parameters in MIRI-LVR rats treated with high-dose of GXDSF treated group and PHTPP. The echocardiograms (A) were obtained using the Vevo 770 high-resolution imaging system. LVEF and LVFS (B) data are also shown in bar graphs. Compared with the sham group, ###P < 0.001. Compared with the MIRI-LVR model group: ∗P < 0.01. Compared with the high-dose of GXDSF treated group: &P < 0.05, &&P < 0.01. The data are presented as the mean ± SD (n = 10 in each group).

