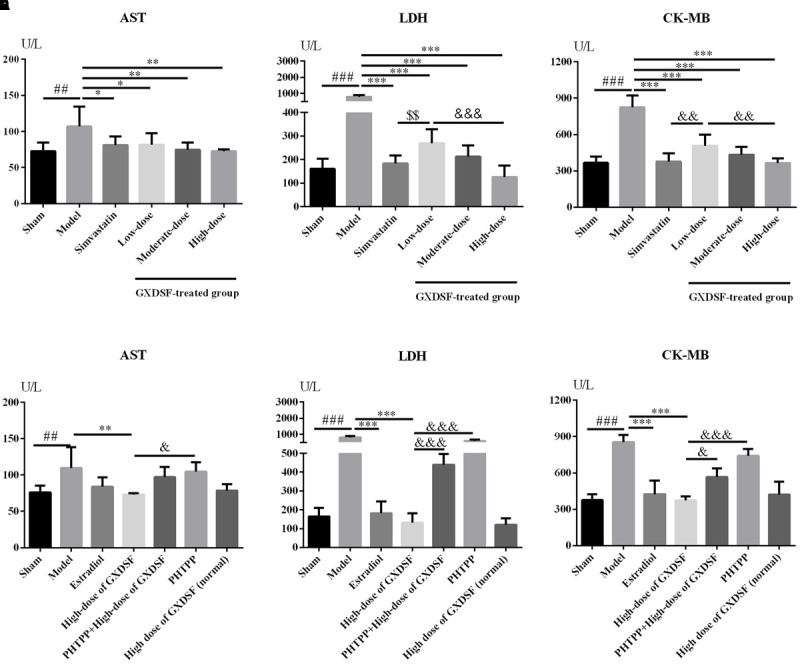
FIGURE 5.

Biochemical parameters, including AST (A,D), LDH (B,E) and CK-MB (C,F), in MIRI-LVR rats treated with different doses of GXDSF and PHTPP. Compared with the sham group: ##P < 0.01, ###P < 0.001. Compared with the MIRI-LVR model group: ∗P < 0.05, ∗∗P < 0.01, ∗∗∗P < 0.001. Compared with the simvastatin group: $$P < 0.01. Compared with the high-dose group: &P < 0.05, &&P < 0.01, &&&P < 0.001. The data are presented as the mean ± SD (n = 10 in each group).
