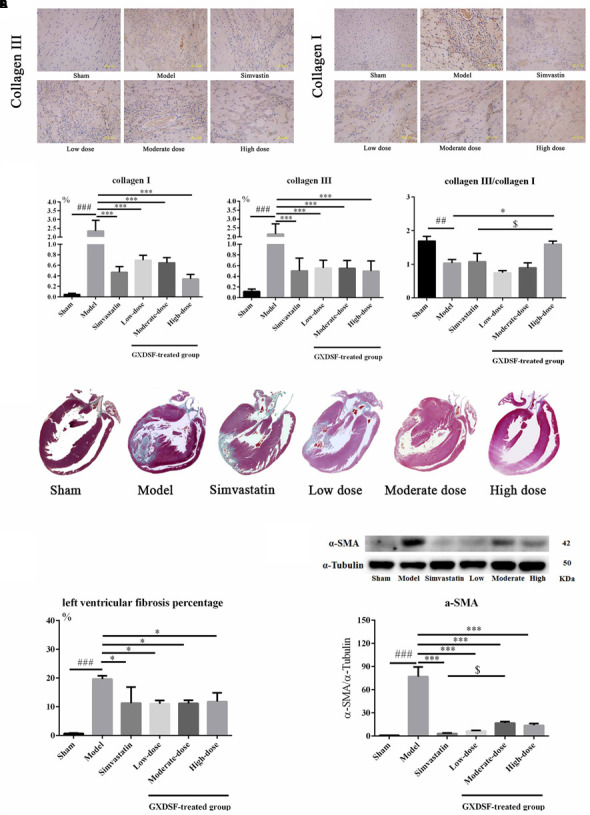
FIGURE 6.

Myocardial fibrosis in MIRI-LVR rats treated with different doses of GXDSF. The immunohistological localization of collagen III (A) and collagen I (B) is shown. Bars represent 50 μm. The relative expression of collagen I and III and the relative ratio of collagen III/I (C) are shown in bar graphs. Masson’s trichrome staining (D) and the percentage of left ventricular fibrosis area (E) are provided. A gel image with an internal reference (α–tubulin) and the relative expression of α–SMA (F; column graph) are shown. Compared with the sham group: ##P < 0.01, ###P < 0.001. Compared with the MIRI-LVR model group: ∗P < 0.05, ∗∗∗P < 0.001. Compared with the simvastatin group: $P < 0.05. The data are presented as the mean ± SD (n = 4 in each group).
