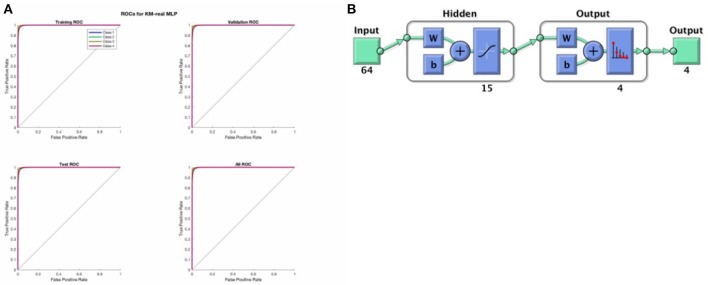
Figure 4.
(A) Above shows the ROC curves for the training set, validation set and the test set as derived from the input data in a randomized fashion according to a 75-15-15 split, for KM-real. We see that the MLP training was successful and good. (B) Shows the architecture of the softmax MLP used for all the MLP models here.

