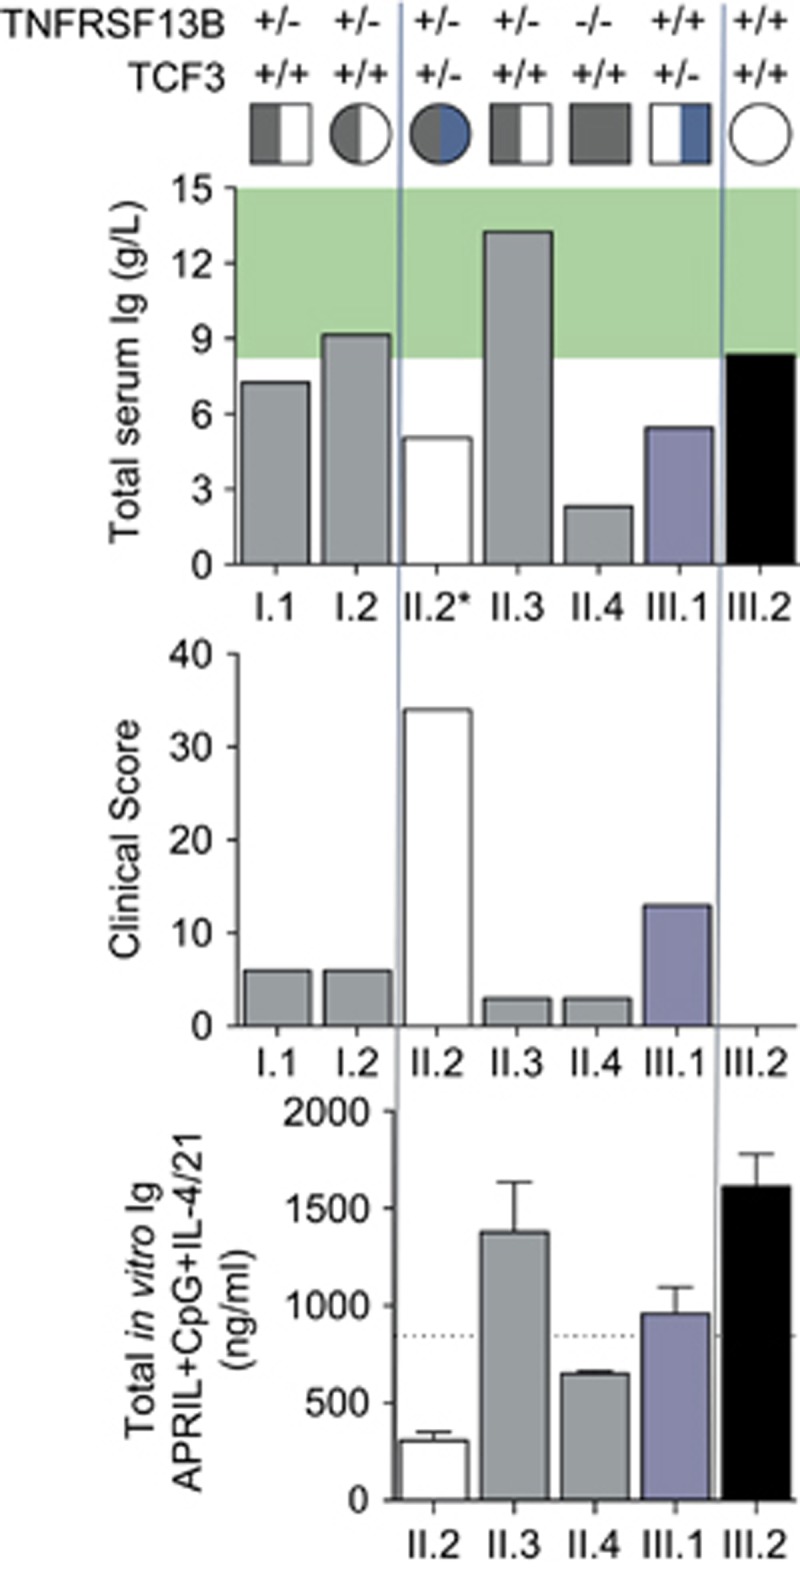
Figure 6.

Quantitation of epistatic interactions of TCF3 and TACI mutations showing a greater net effect than the sum of each individual mutation. Total Serum Ig, clinical score and TNFRSF13B/TACI C104R and TCF3 T161fsX191 genotype for each family member, as indicated. The serum IgG for the proband II.2 was obtained in 2002. Normal serum Ig ranges (g l−1) shaded in green. Lower graph: summary of total Ig levels detected in naïve B-cell cultures for each available family member, stimulated with APRIL, CpG, IL-4+IL-21 for 6 days as described. Indicated line is the total Ig level expected for the proband (II.2) calculated from the sum of deficits observed for each mutation alone (that is Ig levelIII.2− (IgIII.2−IgIII.1)+(IgIII.2−IgII.3)). Note that the clinical score for individual III.2 is 0.
