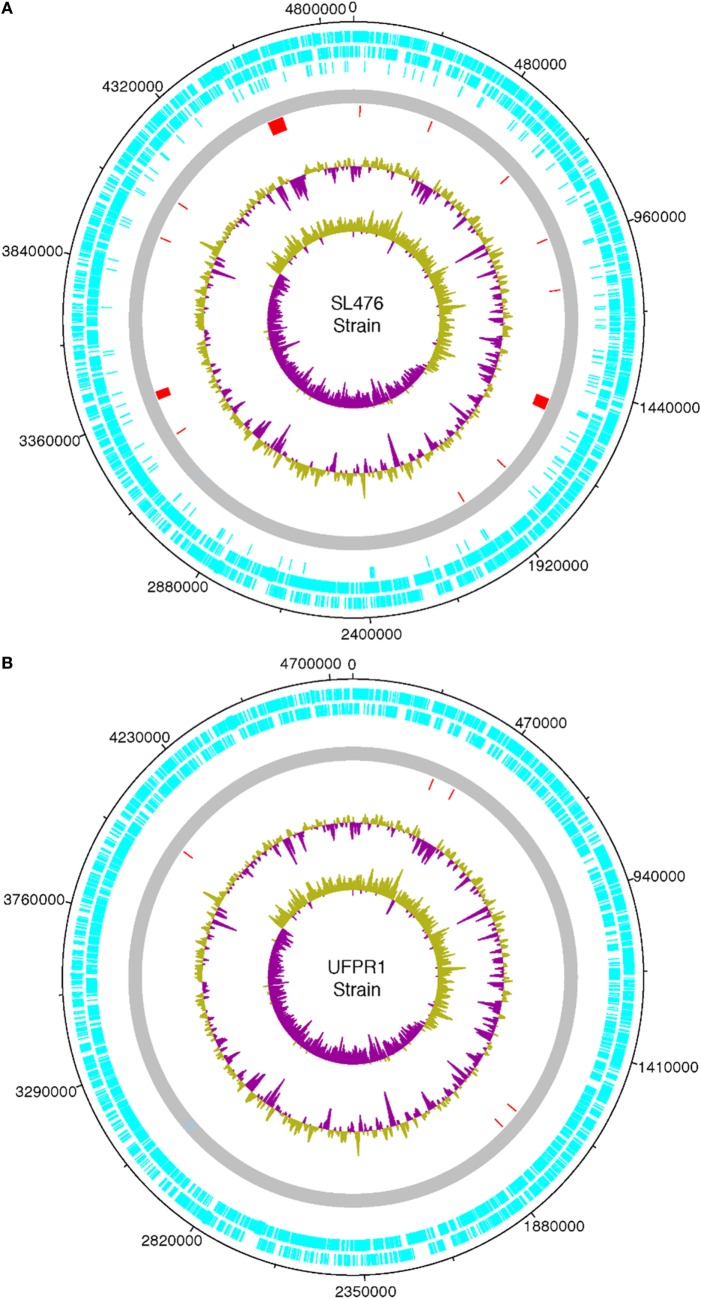
Figure 6.
Chromosome features of a Brazilian UFPR1 strain (B) compared to SL476 strain (A) isolate. The circular map was drawn using DNA Plotter. Different features are shown in different colored bars. The coding sequences are shown in light blue (forward and reverse). The complete genome is shown in gray, the red dashes represents unique chromosome regions that have no homologous sequence in the genome of the other strain, green and purple in the major circle represent the GC content, while in the central circle show the GC skew [(G − C)/G + C]. Regions with GC content below the average are shown in purple and those with content above the average are shown in green.

