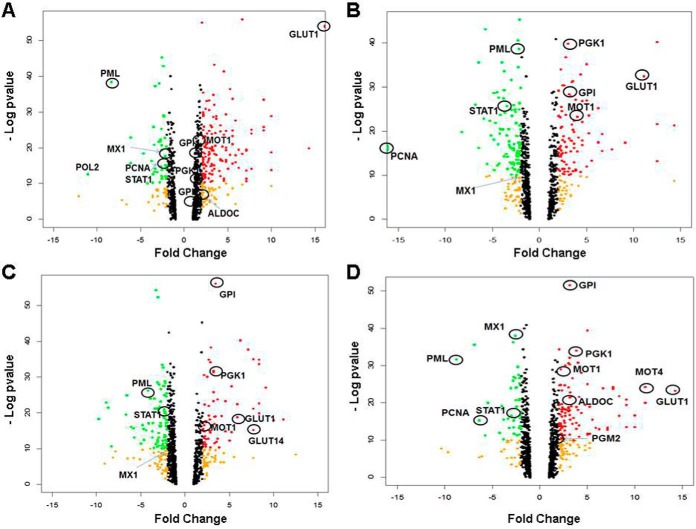
Fig. 3.
Volcano plots of data from label free quantification of proteins. Dots representing proteins with fold change (compared with normoxia) > ± 2 expression are colored in orange; fold change > 2 and significance [- Log10(p value)] >10 are in red; fold change < 2 and significance >10 are in green. The upregulation zone included proteins involved in glycolysis and transportation of glucose and lactate; the downregulation zone included proteins involved in tumor suppression, anti-inflammation and replication, which are selectively circled and named. A-D, Hypoxia for 1–4 days.

