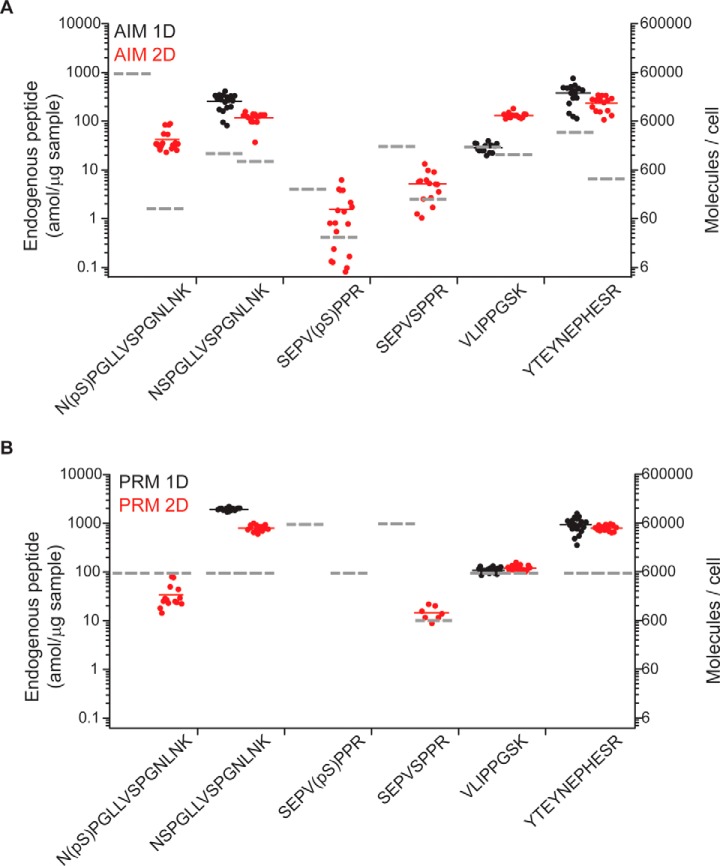
Fig. 5.
Cellular amount of endogenous peptides from protein MEF2C in 1 μg sample, from ∼10,000 cells, as determined by 1D (black) and 2D (red) using A, AIM and B, PRM acquisition. Quantification of endogenous phosphorylated peptides was exclusively achievable using SCX. Each dot represents an independent measurements (full horizontal lines indicate average). LOD for each assay, established from serially diluted isotopologs, is denoted with dashed lines in correspondence.

