Fig. 5.
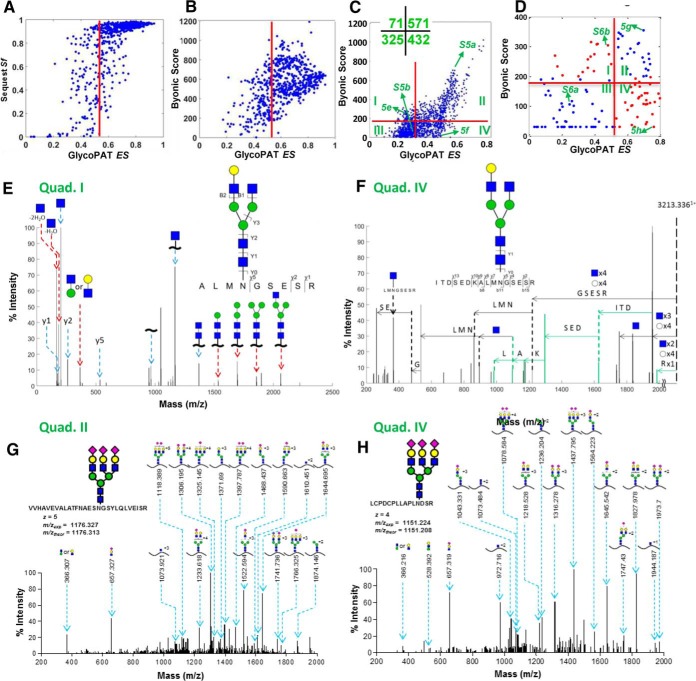
Comparison of GlycoPAT, Byonic and SEQUEST for proteomics and glycoproteomics analysis. A, Plot compares the SEQUEST final score (Sf) and GlycoPAT ensemble score (ES) for trypsin digested peptides of fetuin. Each point represents a file analyzed using both GlycoPAT and SEQUEST. There is good agreement between both software for proteomics studies. B, Byonic score compared with GlycoPAT ES for trypsin digested fetuin peptides (i.e. pure proteomics analysis). Good agreement is seen between the two programs. C, Comparison of Byonic versus GlycoPAT scores for HCD-mode MS/MS data obtained from trypsin-digested Basigin/CD147 glycopeptides. Spectrum in quad.-I received higher Byonic scores whereas those in quad.-IV had higher GlycoPAT ES. Number of spectra in each quadrant is enumerated in inset. D, Byonic score versus GlycoPAT ES for CID mode MS/MS spectra obtained using trypsin cleaved glycopeptides of fetuin. Scores are in agreement in quad.-II and -III only. E and F, Annotated HCD-mode MS/MS spectrum for selected files from Quad-1 and -IV of panel C. Peaks uniquely identified by Byonic are marked using red arrows (panel E, Quad-I). Peaks unique to GlycoPAT because of simultaneous glycan and peptide backbone fragmentation are in green (panel F, Quad-IV). G and H, Annotated CID-mode MS/MS spectrum using GlycoPAT. Good agreement is seen for both Quad-II (high ES, Byonic score, panel G) and Quad-IV (high ES, low Byonic score, panel H). GlycoPAT analyzes the ladder pattern of products formed following serial glycan fragmentation. Byonic, however, does not score glycan fragmentation.

