Fig. 6.
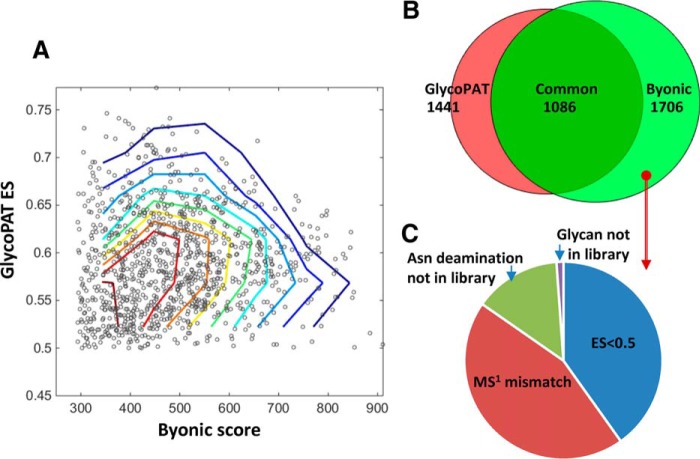
Glycoproteome of prostate cancer cells. Glycoproteomics analysis using GlycoPAT was performed for 22 tandem-MS runs that analyzed cell lysates from a mixture of two prostate cancer cell lines, LNCaP and PC-3. Results were compared with Byonic results reported by Shah et al. (2015) (36). A, Dot plot showing summary scores for GlycoPAT (ES) and Byonic, along with contour lines. Each dot represents the same MS/MS spectrum-glycopeptide identification by both GlycoPAT and Byonic. High GlycoPAT scores generally agreed with Byonic assignments, though some scatter in the data is evident. B, Venn diagram showing overlap in the number of spectra identified using GlycoPAT and Byonic. Most of the identifications were common, though some hits were unique to GlycoPAT because of consideration of simultaneous fragmentation events on the glycan and peptide backbone. C, 620 files uniquely identified by Byonic were not identified by GlycoPAT. This was because of differences in precursor monoisotopic mass assignment, lower than acceptable ES score or library used for the search.

