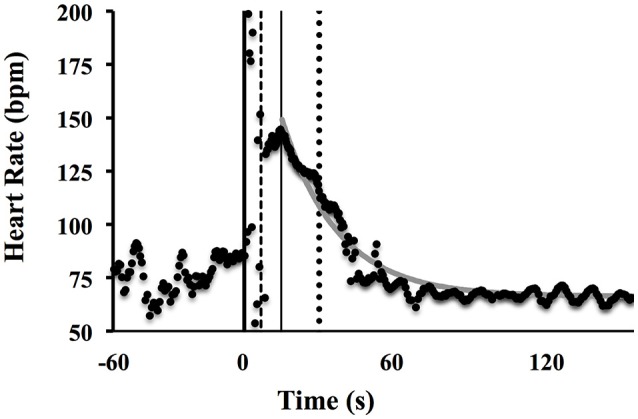
Figure 1.

Example of a representative heart rate time course from rest to recovery of the maximal sprint test. The thick vertical line coincides with the start of the sprint, the dashed vertical line with the end of the sprint, the thin vertical line represents the start decay of HR, while the dotted line expresses the τoff and the gray continuous curve represents the mono-exponential best fit.
