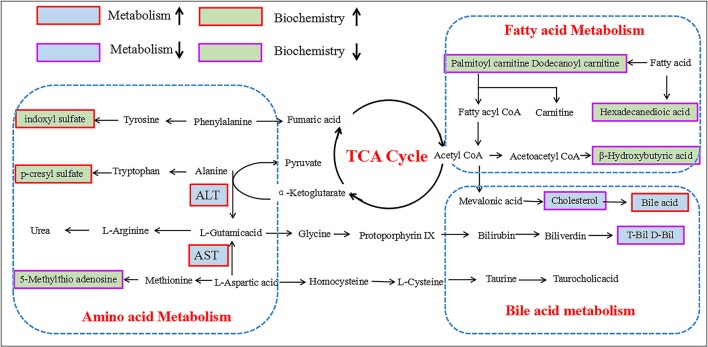
Figure 5.
Schematic diagram of the metabolic pathway related to PM induced rat liver injury. The boxes bordered in red and purple represent metabolites that are significantly higher and lower in the PM groups than in BC group, respectively. The light green and light blue boxes indicate metabolites significantly higher and lower in the model group than in the control group, respectively. The related metabolic pathways are cycled in a black box; ALT, glutamate pyruvate transaminase; AST, aspartate aminotransferase.

