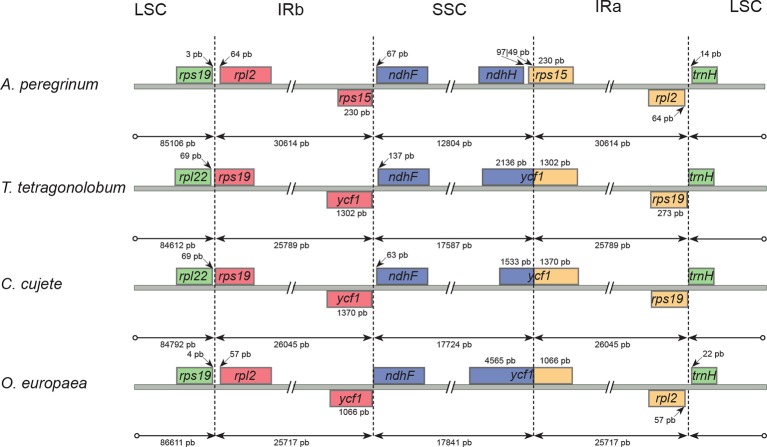
Figure 2.
Comparisons of the Long Single Copy (LSC), Small Single Copy (SSC), and Inverted Repeated (IR) region borders among four Lamiales chloroplast genomes. Genes shown above the lines are transcribed forward while genes shown below the lines are transcribed reversely. Two-headed arrows indicate plastome partition sizes in base pairs and single-headed arrows indicate size of features or distances between plastome partition borders and features.

