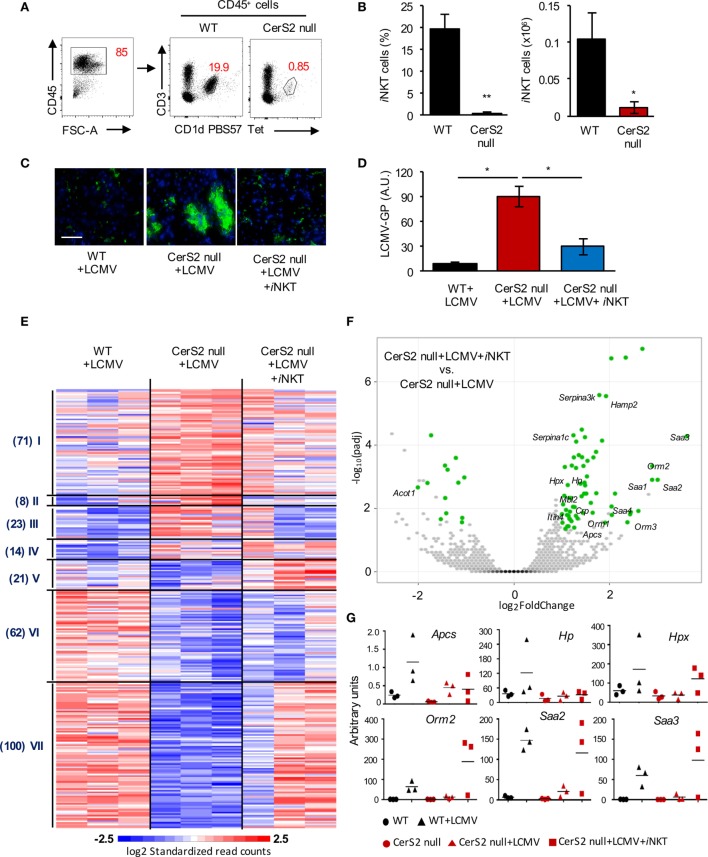
Figure 2.
Reduced invariant NKT (iNKT) cells in the liver of ceramide synthase 2 (CerS2)-null mice account for their susceptibility to LCMV infection. (A) Representative flow cytometry plots showing the percent of CD3+CD1d-PBS57 tetramer+ iNKT cells (indicated by numbers in red) out of total hematopoietic (CD45+) cells. (B) Percent and absolute numbers of iNKT cells (n = 4). (C) Representative images of viral staining in liver of wild-type (WT), CerS2 null, and CerS2-null mice after adoptive transfer of isolated WT iNKT cells 2 days post-infection. Scale bar, 20 µm. (D) qPCR of LCMV-glycoprotein (GP). The experiment was repeated three times with similar results. Black columns, WT; red columns, CerS2 null. (E) Heatmap of mRNA profiles of liver from LCMV-infected WT, CerS2-null mice, and CerS2-null mice after WT iNKT cell transfer (n = 3). Differentially expressed genes were clustered using Pearson’s dissimilarity, and the number of partition clusters was set to seven. (F) Volcano plot displaying statistical significance (−log10 adjusted p value) against the log2 ratio between LCMV-infected CerS2-null mice and LCMV-infected CerS2-null mice after iNKT cell transfer, based on RNA-seq data. Significantly changed genes (log2 fold change, adjusted p value< 0.05, n = 3 for each group) are represented by green symbols. Genes are labeled that were significant and common between LCMV-infected CerS2-null mice/LCMV-infected CerS2-null mice after iNKT cells transfer and WT mice before and after LCMV infection but not in CerS2 null before and after LCMV infection. (G) qRT-PCR analysis of various differentially expressed genes from cluster VII.

