Figure 4.
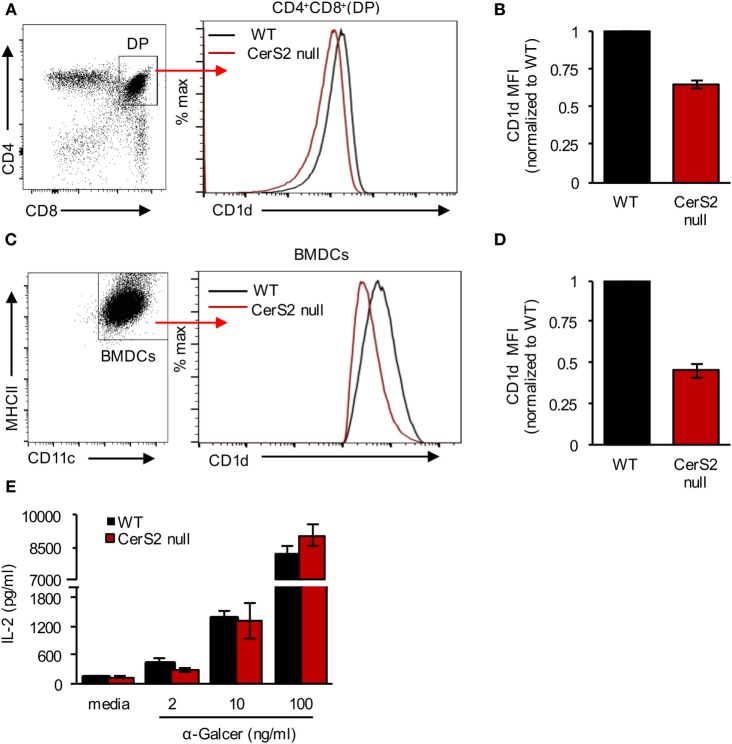
CD1d expression in ceramide synthase 2 (CerS2)-null mice. (A) Representative flow cytometry plot of CD4+CD8+ DP thymocytes (left panel) and histogram showing surface expression of CD1d on DP thymocytes in the thymus of wild-type (WT) and CerS2-null mice (right panel) (B) Quantitation of mean fluorescence intensity (MFI) of CD1d on DP thymocytes in WT and CerS2-null mice (n = 4). (C) Representative flow cytometry plot of BMDCs (left panel) and histogram (right panel) showing CD1d surface expression on BMDCs derived from WT and CerS2-null mice. (D) Quantitation of MFI of CD1d on BMDCs derived from WT and CerS2-null mice (n = 3). The experiment was repeated three times with similar results. (E) Activation of DN32.D3 NKT hybridoma cells by α-GalCer incubated with BMDCs. The experiment was performed three times in triplicate with similar results. Black columns, WT; red columns, CerS2 null.

