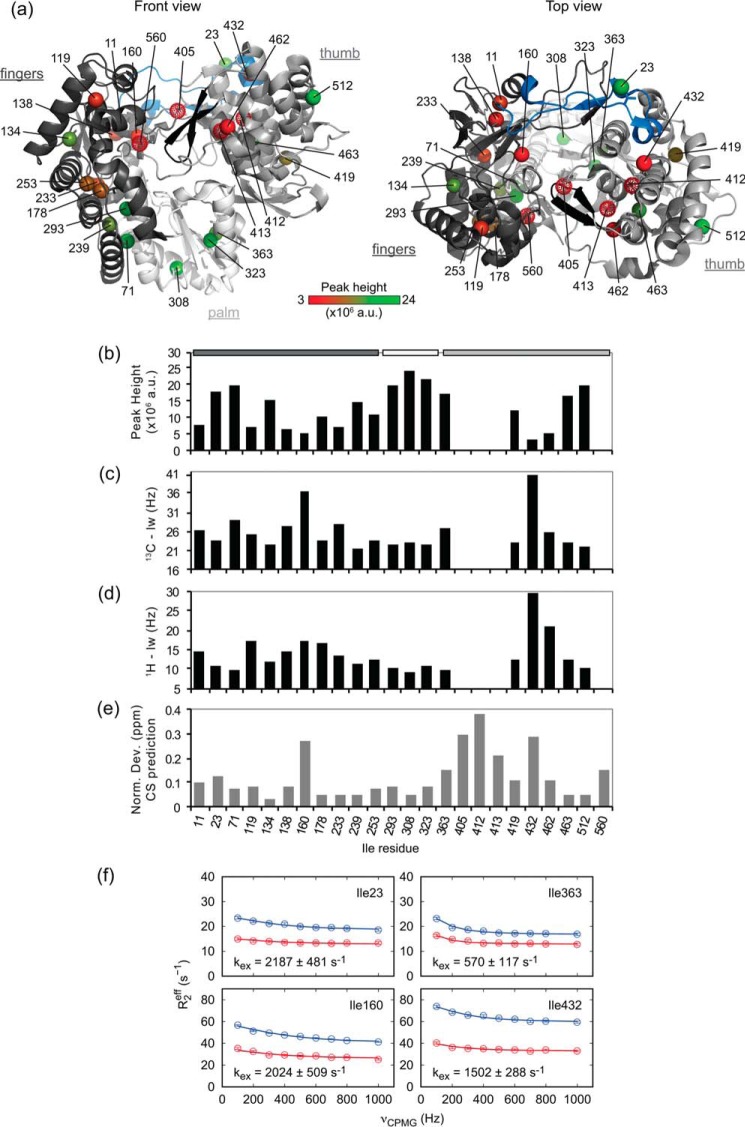
Figure 2.
NMR properties of Ile methyl groups in NS5B. a, structure of NS5B (PDB code 2XXD) shown in a schematic representation (as in Fig. 1). Ile δ1 methyl groups, shown as spheres, are colored from red to green according to peak heights of the corresponding resonances in the methyl-TROSY spectrum (shown in b). Methyl groups that are not observed are shown as red dotted spheres. Two important structural features of NS5B are highlighted: the Λ1 loop (fingertips; residues 12–44) in blue and the β-flap (residues 443–454) in black. The figures were prepared using PyMOL. b–d, peak height (b) and line width at half-height in the 13C dimension (13C lw) (c) and in the 1H dimension (1H lw) (d) of Ile methyl (δ1) groups in the methyl-TROSY spectrum of NS5BΔ21. NS5B subdomains are indicated at the top with the same color code as in a. e, normalized deviations (Equation 3) of 1H,13C combined chemical shift predictions of Ile methyl (δ1) groups calculated with SHIFTX2 on available crystallographic structures of NS5B from the HCV JFH1 strain (see supplemental Table S4 and Fig. S3). f, methyl-TROSY MQ CPMG relaxation dispersion data for NS5BΔ21 Ile residues 23 (fingertips), 160 (fingers), 363 (palm), and 432 (thumb). Red, 600 MHz; blue, 900 MHz. Exchange rates kex fitted for each individual residue are indicated in the panels. Residues 23 and 432 were fitted with 1H and 13C Δω allowing to vary; residues 160 and 363 were fitted allowing only 13C Δω to vary. a.u., arbitrary units.

