Figure 7.
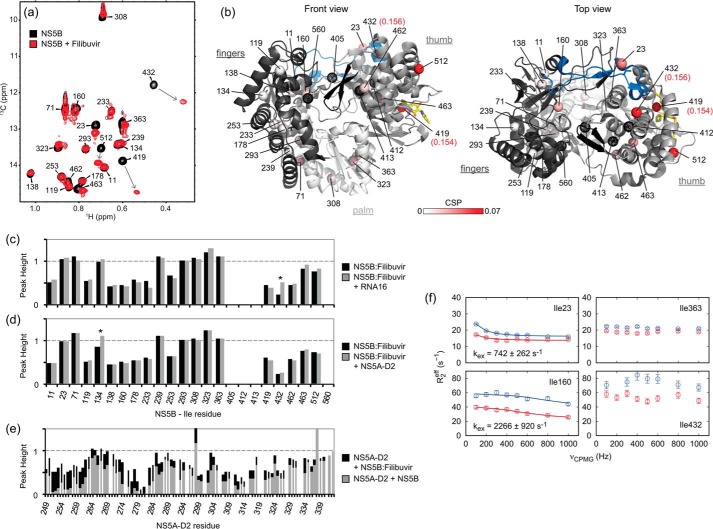
NS5B and its inhibition by filibuvir. a, superposition of methyl-TROSY spectra of NS5BΔ21 (in black) and the NS5BΔ21–filibuvir complex (in red). b, 1H,13C combined CSPs following filibuvir binding are mapped, from white (0 ppm) to red (0.07 ppm), onto the Ile methyl groups of the NS5B structure (PDB code 2XXD). CSPs for Ile-419 and Ile-432 are 0.154 and 0.156 ppm (above the defined upper limit) and are highlighted. Methyl groups that were not observed are depicted as black dotted spheres. Figures were prepared using PyMOL. c, effect of filibuvir on the NS5B interaction with RNA16. Relative peak heights of Ile methyl (δ1) resonances in 1H,13C TROSY spectra of the NS5BΔ21–filibuvir complex (50 μm) obtained in the absence and in the presence of RNA16 (30 μm) are shown. For each spectrum, peak intensities are normalized to the Ile-293 signal. d and e, effect of filibuvir on the NS5B interaction with NS5A-D2. d, relative peak heights of Ile methyl (δ1) resonances in 1H,13C TROSY spectra of the NS5BΔ21–filibuvir complex (50 μm) obtained in the absence and in the presence of NS5A-D2 (50 μm) are shown. For each spectrum, peak intensities are normalized to the Ile-293 signal. e, relative peak heights of backbone amide resonances in 1H,15N HSQC spectra of 15N-labeled NS5A-D2 (20 μm) in the presence of unlabeled NS5BΔ21 (100 μm; gray bars) or unlabeled NS5BΔ21–filibuvir complex (100 μm; black bars), normalized to peak heights in the absence of NS5B. f, methyl-TROSY MQ CPMG relaxation dispersion data for NS5BΔ21 Ile residues 23 (fingertips), 160 (fingers), 363 (palm), and 432 (thumb) in the presence of filibuvir. Red, 600 MHz; blue, 900 MHz. For residues 23 and 160 exhibiting non-flat dispersion curves, exchange rates (kex) fitted individually are indicated in the panels. Fits were performed allowing only 13C Δω to vary.

