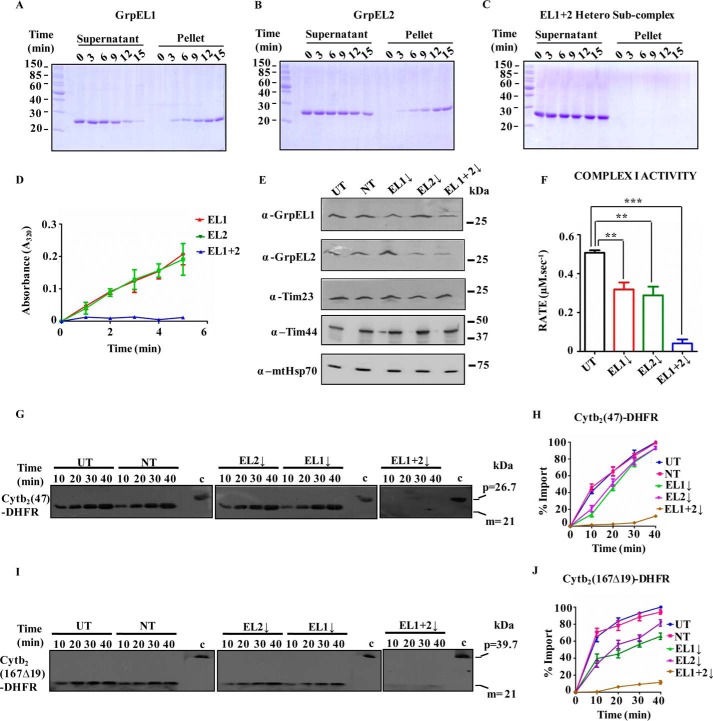
Figure 4.
A–D, stability analysis of NEFs. 2.5 μm EL1 alone (A), EL2 alone (B), or EL1-EL2 complex (C) was incubated at 37 °C at the indicated time intervals and subjected to centrifugation to separate supernatant and pellet fractions followed by SDS-PAGE analysis. The reduced aggregation propensity of the above proteins was analyzed spectrophotometrically under similar experimental conditions by measuring the absorbance at 320 nm as a function of time (D). Data are represented as mean ± S.E. (n = 3). Error bars represents S.E. p (two-tailed) < 0.001. E, silencing of NEFs by siRNA. Western blot of HEK293T cells in which EL1, EL2, or EL1-EL2 was down-regulated by siRNA. Untransfected (UT) cells and non-targeting siRNA (NT) were used as negative controls for siRNA-mediated down-regulation. Anti-Tim23 antibody was used as a loading control. The blots were probed for import motor components (Tim44 and mtHsp70) as positive controls. F, activity of electron transport chain complex I in mitochondria isolated after down-regulation of NEFs. Student's t test was used to compare the rate in cells with down-regulated EL1 (EL1↓), EL2 (EL2↓), or EL1-EL2 together (EL1+2↓) with that in untransfected cells. Data are represented as mean ± S.E. (n = 3). Error bars represents S.E. ***, p (two-tailed) < 0.0001; **, p (two-tailed) < 0.05. G–J, in vitro protein import kinetics. Import activity in the isolated intact mitochondria from untransfected cells (UT), cells transfected with non-targeting siRNA (NT) (left panels), and cells showing down-regulation (↓) for either EL1 alone, EL2 alone (middle panels), or EL1-EL2 together (right panels) was measured at the indicated time intervals using mitochondrion-specific substrates Cytb2(47)-DHFR (G) and Cytb2(167Δ19)-DHFR (I). Precursor protein of 39.7 kDa and mature protein of 21 kDa are represented as “p” and “m.” “c” represents control. Blots were developed with identical exposure, quantitated by densitometry, and represented graphically as percentage of import by setting the highest import point as 100% in each case (H and J). Data represented as mean ± S.E. (n = 3). Error bars represents S.E. p (two-tailed) < 0.0001.

