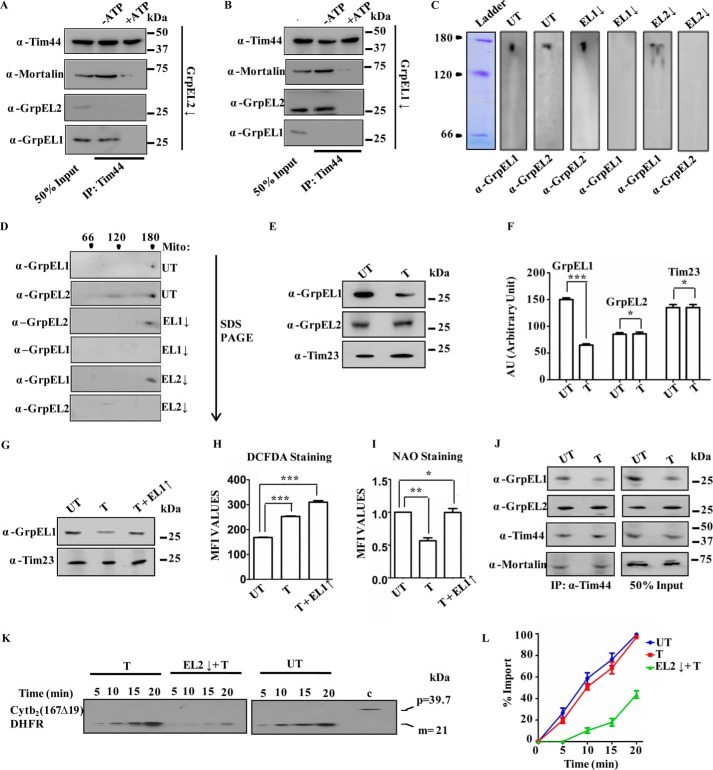
Figure 5.
A and B, coimmunoprecipitation. Immunoprecipitation was performed in isolated mitochondria from HEK293T cells silenced for EL2 (A) and EL1 (B) in the presence of 2 mm ATP (+ATP) or in the presence of 5 mm EDTA (−ATP) using anti-Tim44 antibody, separated by SDS-PAGE, and immunodecorated with the indicated specific antibodies. 50% of the sample served as input control. C and D, analyses of the oligomeric nature of NEFs in mitochondria. Mitochondrial lysates prepared from untransfected cells (UT) or cells treated with siRNA to down-regulate (↓) EL1 and EL2 were separated by blue native PAGE (C) and 2D SDS-PAGE (D) and immunodetected by anti-GrpEL1 and -GrpEL2 antibodies. The second dimension direction for SDS-PAGE is marked by an arrow, and the positions of molecular mass markers are indicated. E–G, expression of NEFs under oxidative stress. Mitochondrial lysates prepared from untreated (UT) cells or cells treated (T) with 100 μm NaAsO2 were analyzed by SDS-PAGE followed by immunodetection using anti-GrpEL1 and -GrpEL2 antibodies (E). The blots were quantitated by densitometry and are presented as a bar chart. Student's t test was used to compare the expression of EL1, EL2, or Tim23 between untreated and treated samples. Data are represented as mean ± S.E. (n = 3). ***, p (two-tailed) < 0.0001; **, p (two-tailed) < 0.05 (F). Similarly, mitochondrial lysates prepared from untransfected cells (UT) or cells treated with 100 μm NaAsO2 in the absence (T) or presence of exogenously overexpressed (↑) GrpEL1 were separated by SDS-PAGE and subjected to immunoblotting with the indicated antibodies (G). H and I, ROS and mitochondrial mass measurements. Generation of total ROS and mitochondrial mass were measured in untransfected cells (UT) or cells treated with 100 μm NaAsO2 (T) or in the presence of exogenously overexpressed (↑) GrpEL1 by DCFDA dye (H) and NAO staining (I) using flow cytometry. The increment in total cellular ROS levels is presented in terms of mean fluorescence intensity (MFI) over untransfected HEK293T cells (UT). Two sets of data (UT with T and UT with T + EL1↑) were compared using Student's t test. Data are represented as mean ± S.E. (n = 3). Error bars represents S.E. ***, p (two-tailed) < 0.0001 (panel H); **, p (two-tailed) < 0.001; *, p (two-tailed) < 0.01 (panel I). J–L, coimmunoprecipitation and protein import under oxidative stress. Immunoprecipitation using anti-Tim44 antibody was performed in the mitochondrial lysates prepared from untreated HEK293T cells (UT) or HEK293T cells treated with 100 μm NaAsO2 followed by SDS-PAGE and immunoblotting using the indicated specific antibodies (J). 50% of the sample served as input control. The protein import kinetics was measured in the isolated intact mitochondria from untransfected cells (UT) or cells treated with 100 μm NaAsO2 (T) alone or together with EL2 down-regulation (T + EL2↓) using Cytb2(167Δ19)-DHFR as precursor protein (K). Blots were developed with identical exposure and quantitated by densitometry and are represented graphically as percentage of import by setting the highest import point as 100% in each case (L). Data are represented as mean ± S.E. (n = 3). Error bars represents S.E. p (two-tailed) < 0.0001.

