Figure 6.
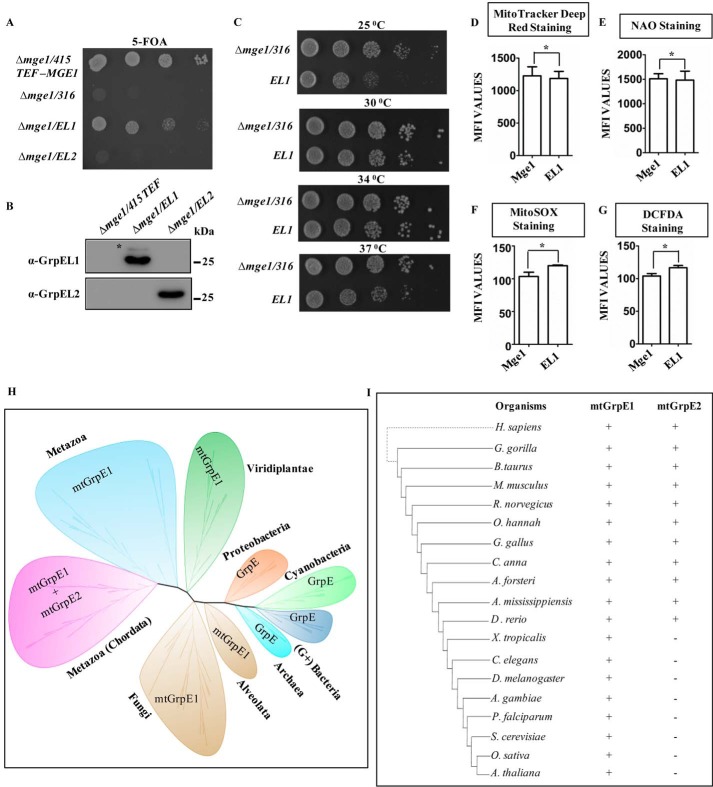
A–C, growth complementation and expression analysis. MGE1-deleted yeast cells harboring a copy of MGE1 in pRS316 plasmid were transformed with pRS415 TEF-MGE1, -EL1, or -EL2 and subjected to drop dilution analysis on 5-FOA medium followed by incubation for 72 h at 30 °C (A). The expression of EL1 (Δmge1/EL1) and EL2 (Δmge1/EL2) in transformed yeast cells was analyzed by immunoblotting and probed with anti-GrpEL1 or -GrpEL2 antibodies. The cells transformed with empty vector were used as a negative control (Δmge1/415 TEF). *, band corresponding to yeast Mge1 due to cross-reactivity with EL1 antibody (B). Temperature-dependent growth complementation by EL1 was analyzed on YPD medium by incubating the plates at 25, 30, 34, and 37 °C for 72 h (C). D–G, mitochondrial functional analysis. The following mitochondrial functional parameters were measured in yeast cells expressing EL1 or Mge1 using flow cytometry: membrane potential by MitoTracker Deep Red (D), total mass by NAO (E), mitochondrial ROS levels by MitoSOX (F), and total cellular ROS levels by DCFDA (G). The mean fluorescence intensity (MFI) for Mge1 in comparison with EL1 is plotted in each case and analyzed using Student's t test. No significant differences in ROS levels, mitochondrial function, and mass were observed between Mge1- and EL1-expressing cells. Data are represented as mean ± S.E. (n = 3). Error bars represents S.E. *, p (two-tailed) < 0.1. H and I, phylogenetic analysis. An unrooted phylogenetic tree for GrpE orthologs across phylogeny was constructed using MEGA software with the Jones-Tailor-Thornton amino acid substitution model and ML heuristic method. Each clade wrapped in a bubble represents a phylum and kingdom level representation of the phylogeny (H). The inference obtained from the unrooted phylogenetic tree (H) was compiled descriptively with selected well studied species to represent the presence (+) and absence (−) of mtGrpE1 and mtGrpE2 across taxonomy (I).

