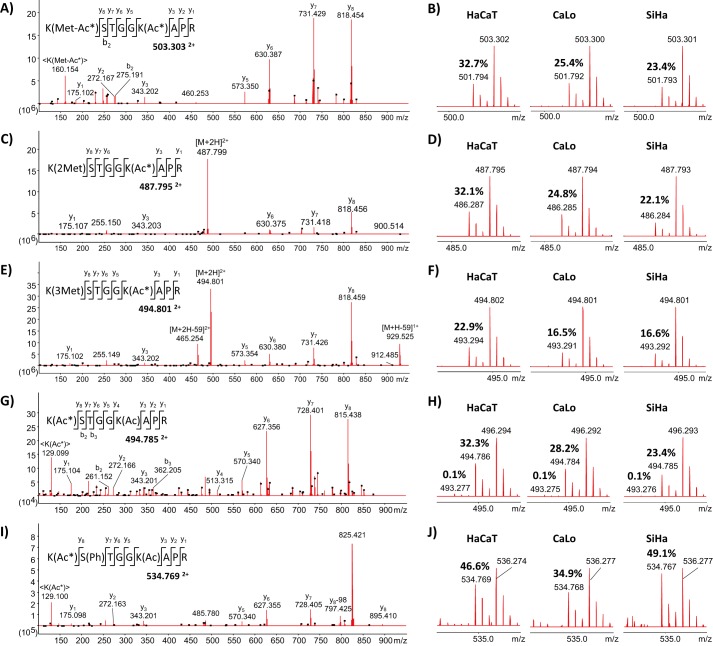
Figure 4.
MS/MS and MS spectra of the peptide 10KSTGGKAPR18 from histone H3 identified in the three cell lines under study with several PTMs in three of the residues. Lys10 was mono-, di-, and trimethylated and acetylated; Ser11 was phosphorylated; and Lys15 was acetylated. Representative MS/MS spectra of the peptide with mono-, di-, and trimethylated Lys10 are illustrated in A, C, and E, respectively. B, D, and F correspond to survey scans showing the isotopic distribution of the peptide mono-, di-, and trimethylated in Lys10 in the three cell lines. The reported values correspond to the degree of endogenous acetylation in the Lys15 residue, confirmed by MS/MS of the signals 501.794, 486.287, and 493.294 Th, respectively. G, representative MS/MS spectrum of the double-charge signal 494.785 Th corresponding to the peptide with Lys15 residue endogenously acetylated. H, survey scans showing the isotopic distribution of the peptide fully acetylated in the three cell lines. The reported values correspond to the degree of endogenous acetylation in one and both lysine residues. I, representative MS/MS spectrum of the double-charge signal 534.769 Th corresponding to the peptide with the Ser11 residue phosphorylated and the Lys15 residue endogenously acetylated. J, survey scans showing the isotopic distribution of the acetylated peptide with phosphorylated Ser11 in the three cell lines. The reported values correspond to the degree of endogenous acetylation in the Lys15 residue.

