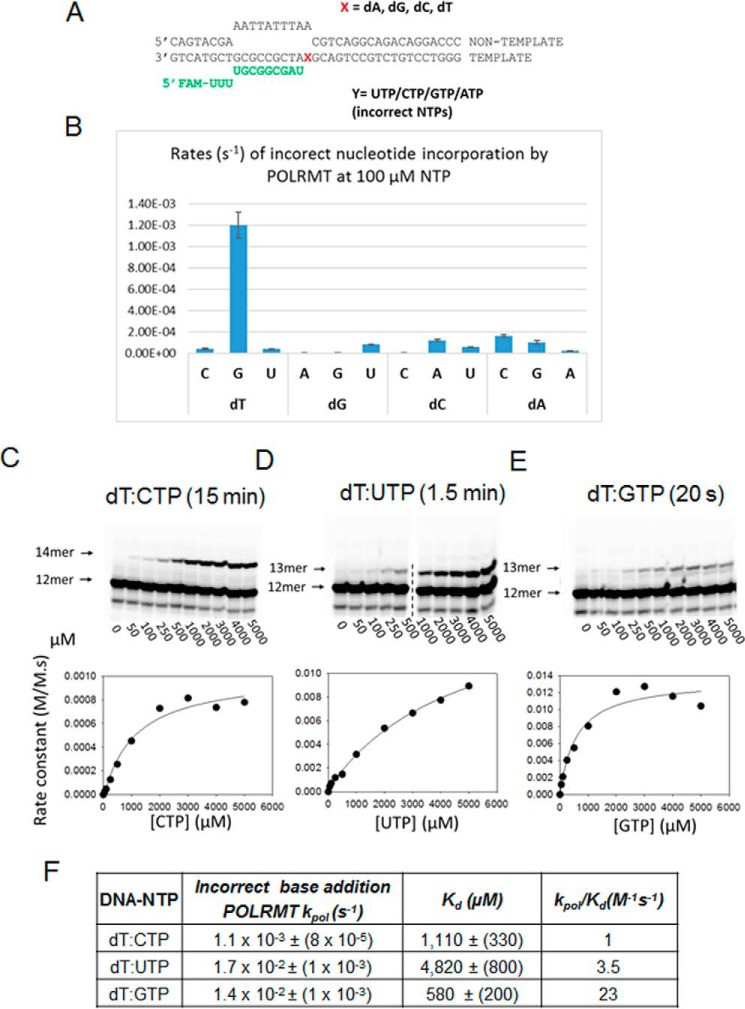
Figure 4.
Incorrect nucleotide incorporation kinetics of POLRMT and the rates of misincorporations across the dT templating base. A, the elongation substrate is shown. FAM, 6-carboxyfluorescein. B, the rates of all possible incorrect nucleotide incorporation reactions were measured using 500 nm ES, 1 μm POLRMT, and 100 μm NTP. Error bars represent S.E. C, the gel image shows CTP misincorporation after 15-min reaction of POLRMT with various concentrations of CTP. The band below the 12-mer is shorter RNA that remained constant in all our reactions. Reactions contained 400 nm POLRMT, 1600 nm dT-ES, and the indicated concentrations of CTP. The dT:CTP misincorporation rate constants plotted against [CTP] were fit to a hyperbola to obtain the kpol and Kd kinetic parameters listed in F. D and E show misincorporation of UTP and GTP, respectively, across dT. F, the table lists the kpol, Kd and kpol/Kd values of all possible misincorporations across dT by the POLRMT.

