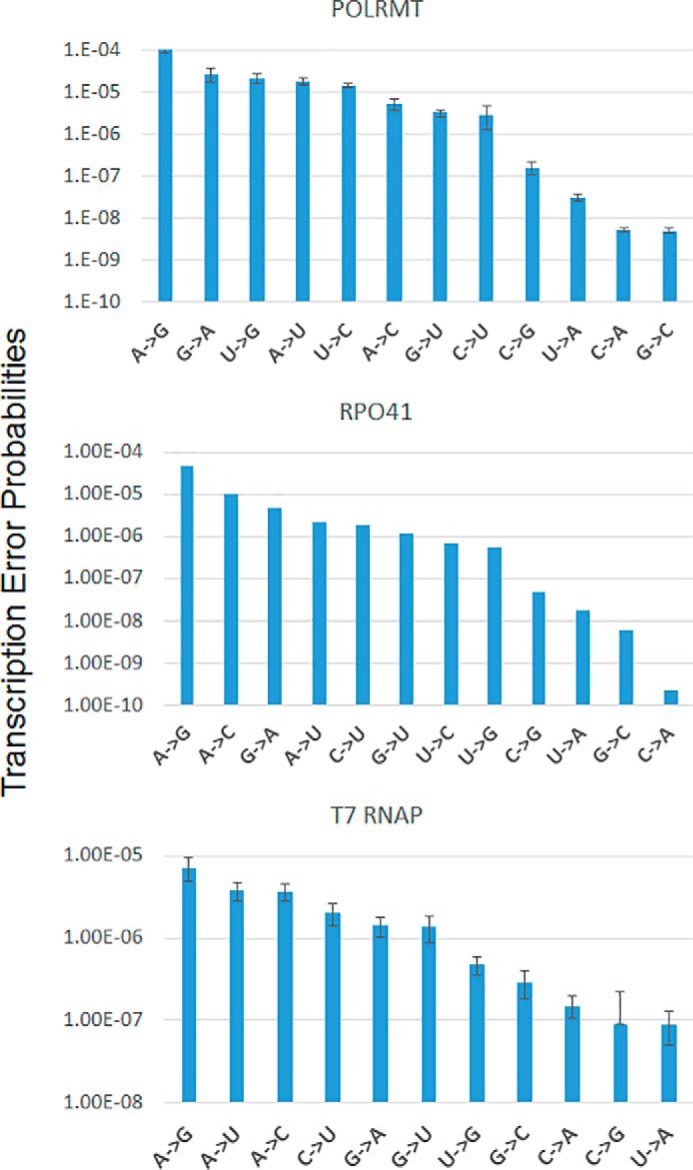
Figure 8.

Summary of the transcription error rates of POLRMT, Rpo41, and T7 RNAP for all possible base pair combinations. The plots summarize the transcription errors rates (from Tables 1–3), organizing the rates from the highest to the lowest for the three RNAPs. The A→G base change occurs with the highest probability (∼10−4) in all three RNAPs. Similarly, the U→A, C→G, and C→A, and G→C base changes occur with the lowest probabilities (∼10−7–10−10) in all three RNAPs. The G→A, U→G, A→U, U→C, A→C, G→U, and C→U base changes occur with intermediate probabilities (∼10−5–10−6). The errors bars show the errors associated with kpol/Kd values of correct and misincorporations from Tables 1–3 calculated using the error propagation method. The error bars for Rpo41 are missing because the Kd values of correct nucleotide addition by Rpo41 was estimated and assumed to be the same as POLRMT.
