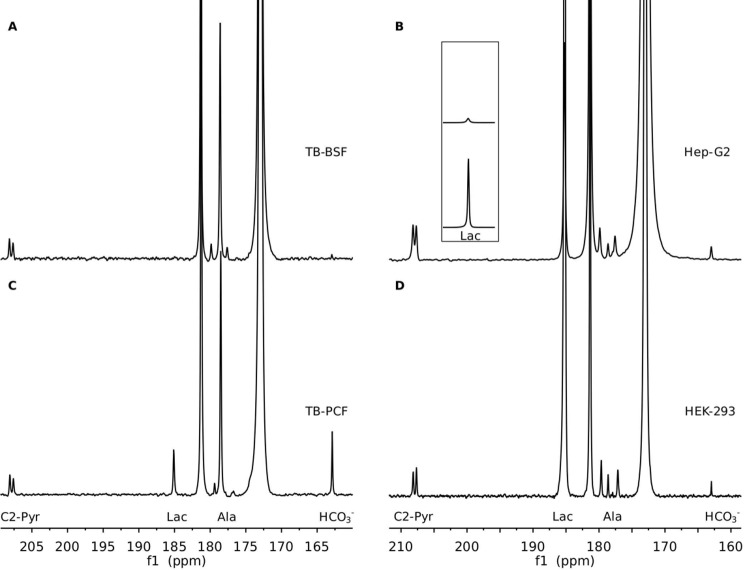
Figure 4.
Comparison of summed 13C spectra for metabolic products from 13C1 pyruvate in T. brucei (A, BSF; C, PCF) and mammalian cells (B, Hep-G2; D, HEK-293). The spectra were summed from the time course spectra in Fig. 2. The inset shows a scaled region for the lactate resonances of B and D, allowing comparison of intensities. Peak intensity was in all cases normalized to the natural abundance pyruvic acid 13C2 resonances.

