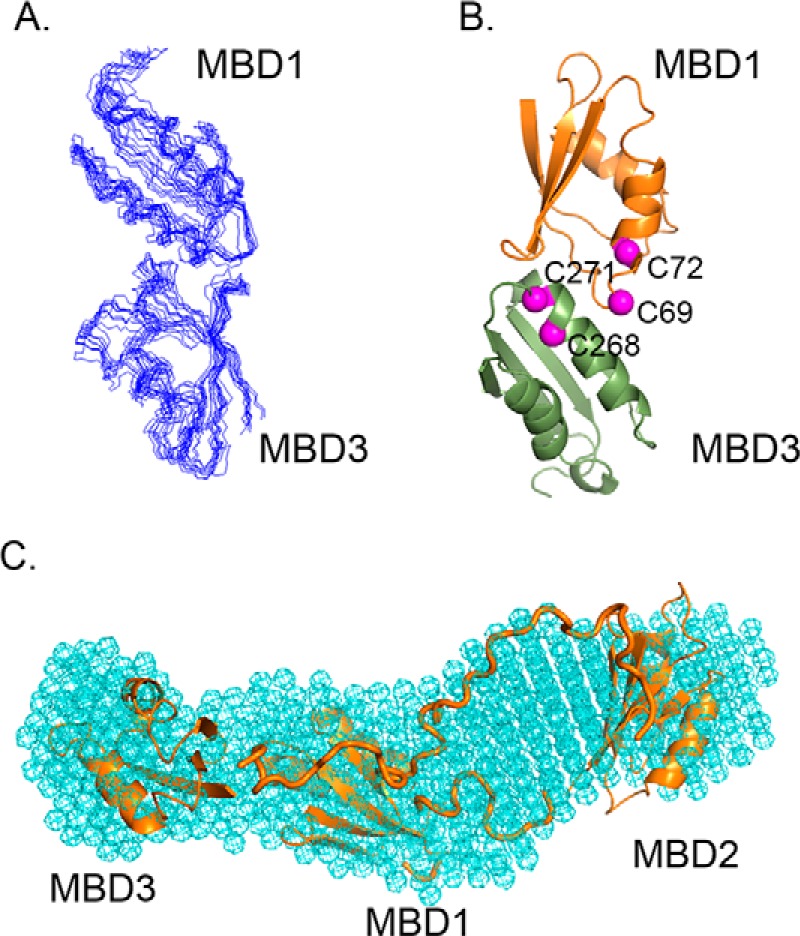
Figure 2.

Conformational space of the MBD1–3 group revealed by molecular docking and SAXS. A, ensemble of the 10 top-scoring MBD1-MBD3 models produced by HADDOCK. B, ribbon diagram of MBD1–MBD3 complex with the α-carbons of the cysteine residues in the invariant CXXC motifs shown in magenta. C, overall shape of the MBD1–3 group determined by SAXS (cyan mesh) with MBDs 1–3 model including connecting loops (orange) fitted into the SAXS shape using SUPCOMB (54).
