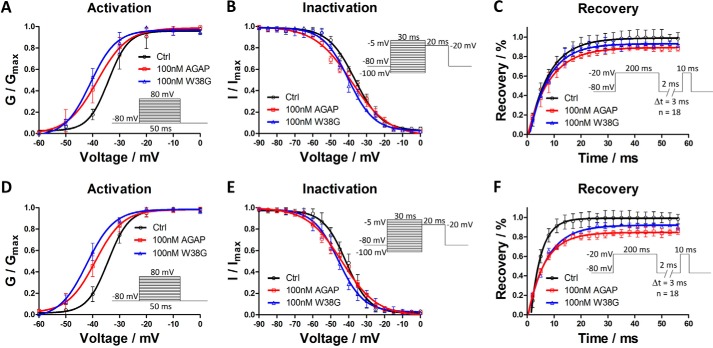
Figure 2.
Effects of AGAP and W38G on voltage dependence of activation and inactivation of hNav1.4 and hNav1.5 and effects of AGAP and W38G on recovery from inactivation of Na+ current. Na+ current was generated by applying pulses from −80 to +40 mV at 10-mV steps for 20 ms from the holding potential of −80 mV in increments of 10 mV. Peak currents were converted into conductance, and normalized conductance of hNav1.4 (A) and hNav1.5 (D) was plotted against the voltages of conditioning pulses. Each point represents mean ± S.E. (n = 6). The currents were elicited with a test pulse at −20 mV for 20 ms following 30-ms prepulses ranging from −100 to 0 mV at 5-mV steps. Peak currents were normalized, and the inactivation curves of hNav1.4 (B) and hNav1.5 (E) were plotted against the command potentials. Each point represents mean ± S.E. (error bars) (n = 6). The currents were obtained at two pulses, consisting of a 200-ms prepulse to −20 mV followed by resting at −80 mV for a time varying from 2 to 56 ms in increments of 3 ms and a test pulse to −20 mV for 10 ms. The I/Imax ratio represented the recovery of Na+ current from inactivation for hNav1.4 (C) and hNav1.5 (F). Each point represents mean ± S.E. (n = 6).

