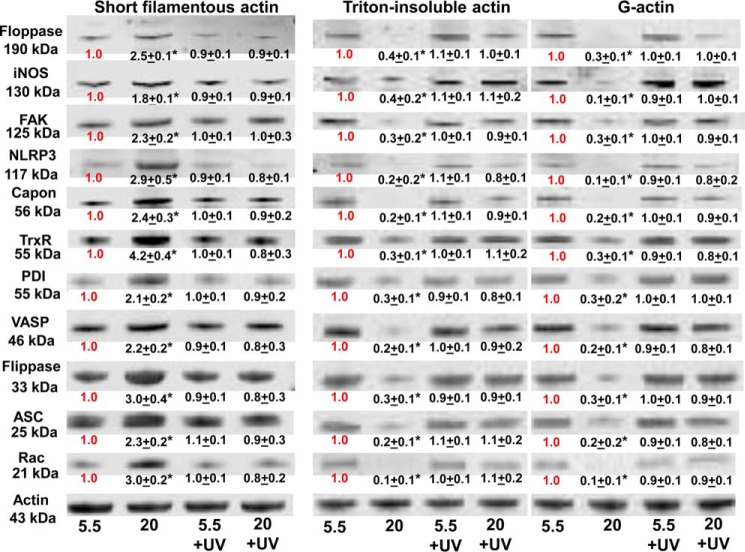
Figure 9.
Protein associations in the Triton-soluble short F-actin, G-actin, and Triton-insoluble actin fractions. Murine neutrophils were incubated with buffer containing 5.5 or 20 mm glucose for 1 h, and where indicated, the samples were exposed to UV light between 30 and 35 min of the 1-h incubation, prior to addition of DTSP, to cross-link the proteins. Samples were then fractioned based on Triton solubility (see “Experimental procedures”) and subjected to Western blotting. Representative blots among three replicate experiments are shown. After Western blotting, protein band densities were quantified and normalized to the actin band in each lysate. The ratio of each protein relative to actin was compared with that calculated for the 5.5 mm glucose neutrophils in each experiment. Therefore, data in the figure show the fold-change in band density normalized to the ratio observed in 5.5 mm glucose (control) cells for each actin fraction. Data are mean ± S.E. (n = 3); *, p < 0.05 versus cells incubated in 5.5 mm glucose and not exposed to UV light.

