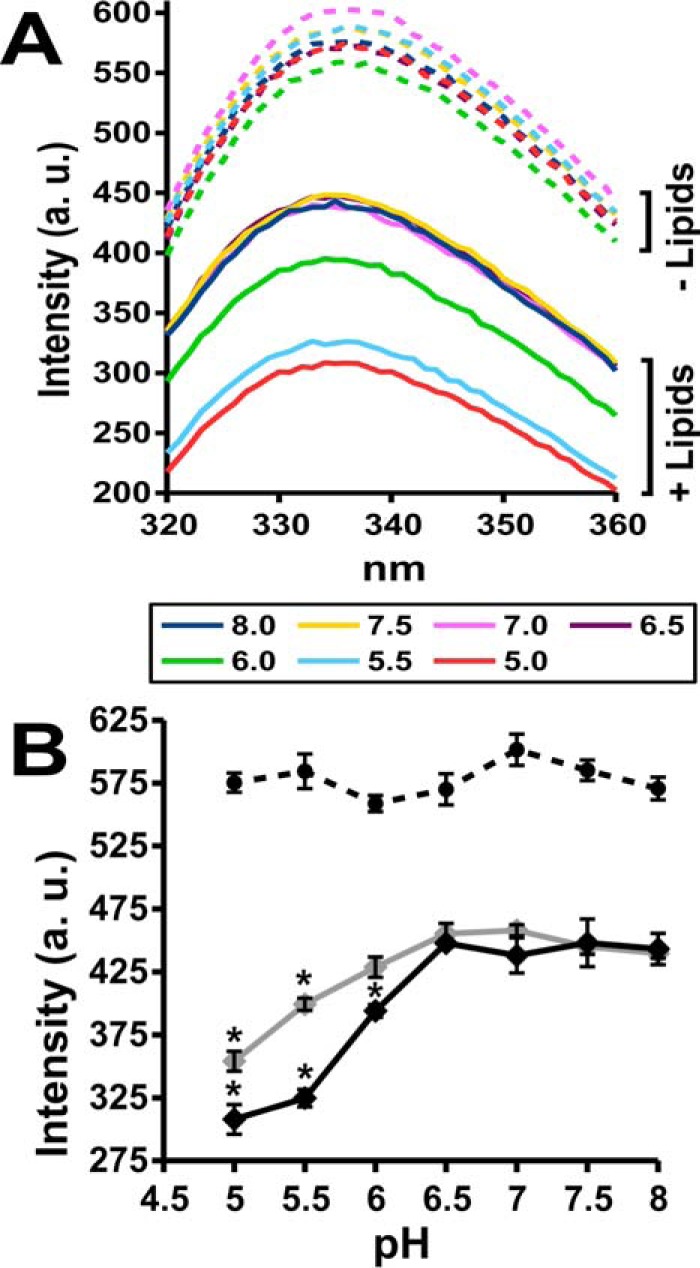
Figure 10.

ApoL1 intrinsic fluorescence changes with membrane association. A, average fluorescence intensity (a.u., arbitrary units) emission spectra (λex = 280) for ApoL1 in the absence or presence of lipid vesicles at a range of pH values. Each tracing is the average of three identical samples. The pH of each tracing is indicated by color. B, fluorescence intensity of ApoL1 at λem = 335 through a range of pH values in the presence (solid line) or absence (dashed line) of vesicles. Fluorescence in the presence of lipids was determined in the presence (black line) or absence (gray line) of 5 mm CaCl2. Data points represent the mean value, and error bars represent S.E.; n = 3 for each data point. *, p < 0.05 compared with intensity at pH 6.5 within each data set determined by ANOVA.
