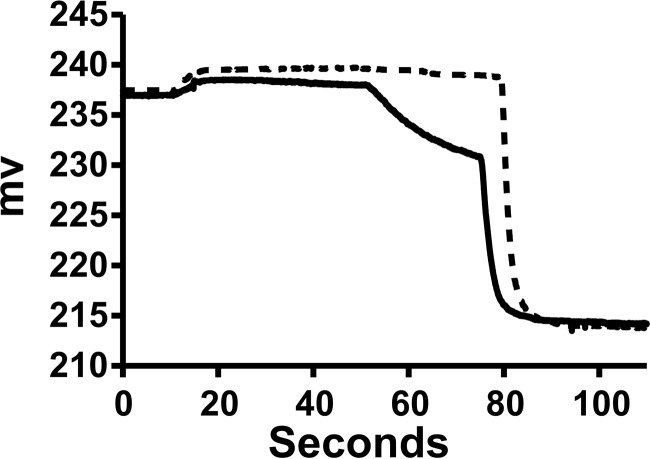
Figure 3.
Representative raw data from a chloride permease assays. Traces from the ApoL1 fraction (solid line) and control buffer (dotted line) are shown. Both the initial reaction mixture and the efflux step were at pH 5.0. The initial recording is of 10−5 m KCl, 2 mm Ca(gluconate)2, and 10 mm MES (pH 5.0) in 300 mm sucrose in the cup. The upward deflection at about 10 s reflects addition of the Bio-gel P-6DG eluate with the chloride-loaded vesicles that dilutes the chloride in the cup. Val is added at 60 s, initiating voltage-driven KCl efflux. Triton X-100 is added at 90 s, releasing all remaining intravesicular chloride. The minimal chloride release before addition of val in both tracings indicates that the vesicle potassium permeability is low with or without ApoL1. The difference in initial rates of release after addition of val is taken as the ApoL1-dependent chloride permeability.

