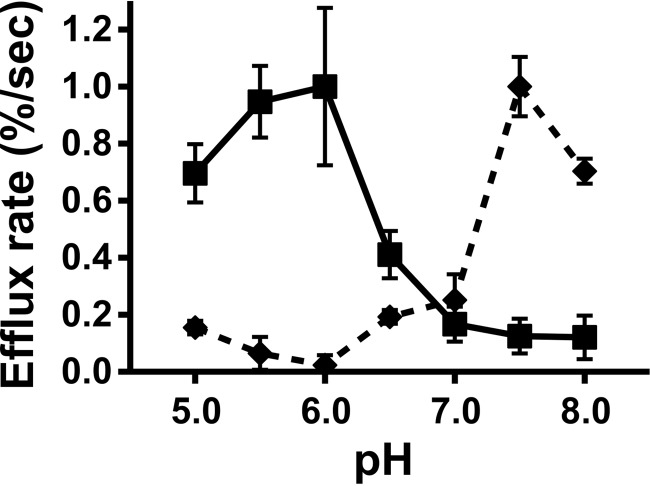
Figure 7.
pH Dependence of potassium permease activity. ApoL1 or control buffer was mixed with vesicles at a range of pH values and then assayed for CI1-dependent efflux at pH 7.5 (square markers, solid line) or mixed at pH 6.0 and then assayed for CI1-dependent efflux at a range of pH values (diamond markers, dotted line). Each point represents the ApoL-1 dependent efflux rate above matched buffer controls; error bars represent S.E., n = 2 for each data point. Activity is greatest when protein and vesicle association occurs at pH 6.0 and efflux occurs at pH 7.5.

