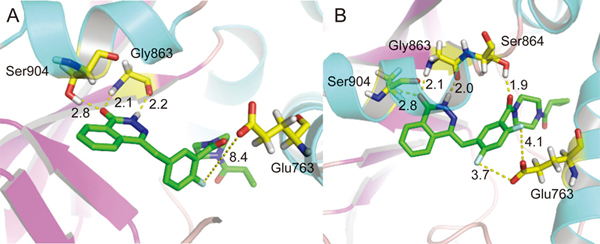
Figure 3.

Molecular docking studies on 1 and 15. Docked poses of 1 (green sticks) (A) and 15 (green sticks) (B) in the NAD+ binding site (cyan and pink cartoon). Hydrophilic interacting residues are represented with yellow carbons. Hydrogen bonding distances (Å) are represented with black numbers. Hydrogen bonds are shown with yellow dash lines.
