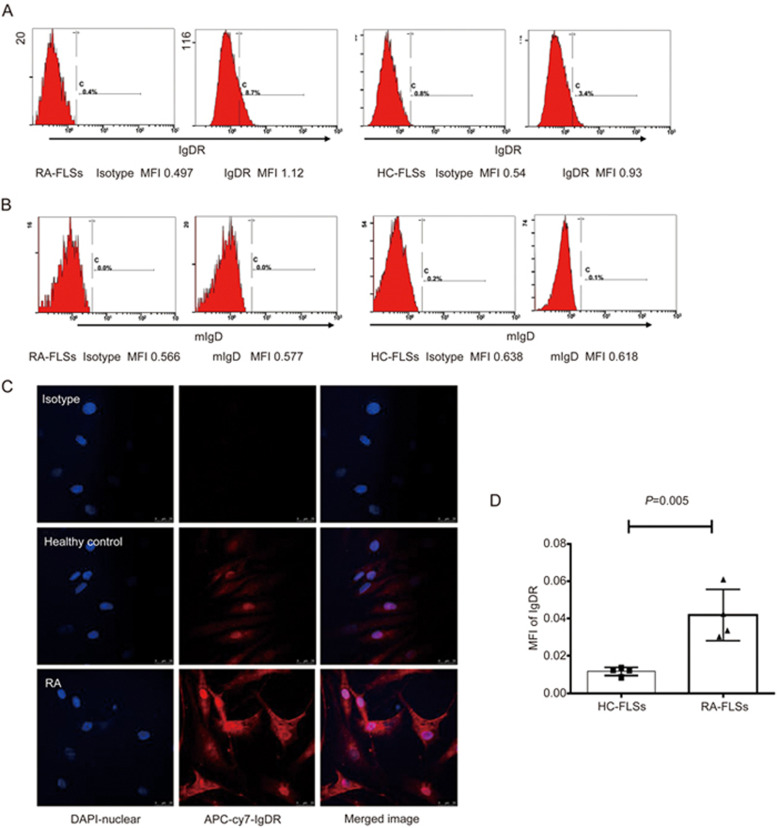
Figure 1.
Expression of IgD and IgDR on FLSs. The expression of IgDR (A) and mIgD (B) was determined by flow cytometry and is indicated by the filled histograms. MFI: Mean fluorescence intensity. (C) Subcellular localization of IgDR in RA-FLSs and HC-FLSs, determined by confocal immunofluorescence microscopy. Colocalization was confirmed when the images were merged (right panel). Isotype matched control primary antibody staining is also shown in C (first line). (D) Quantification of IgDR expression by confocal microscopy analysis. Data represent the mean±SEM (n=4).

