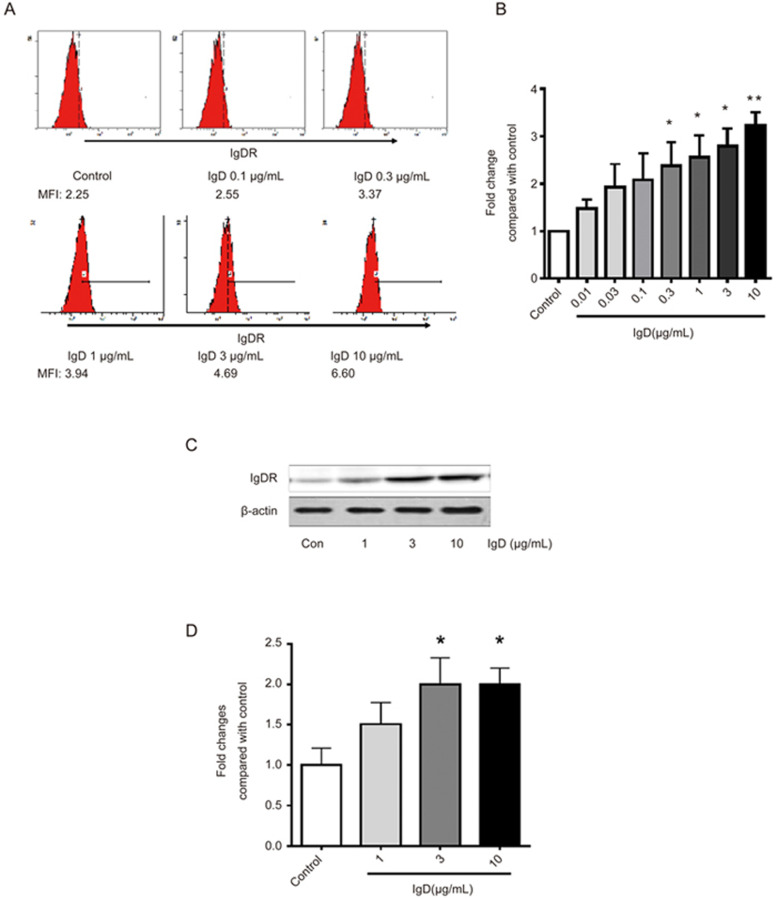
Figure 3.
Effect of IgD on the expression of IgDR on RA-FLSs. RA-FLSs were stimulated with 0.1, 0.3, 1, 3, 10 μg/mL of IgD for 48 h. (A) Dose dependent induction of IgDR expression on FLSs was assayed by flow cytometry. MFI: Mean fluorescence intensity. (B) Bar graphs show quantitative evaluation of expression of IgDR by MFI. (C) Expression of IgDR in FLSs was assayed by Western blotting. (D) Bar graphs show quantitative evaluation of expression of IgDR by densitometry. Data represent the mean±standard error of the mean (n=3). *P<0.05, **P<0.01 vs control.

