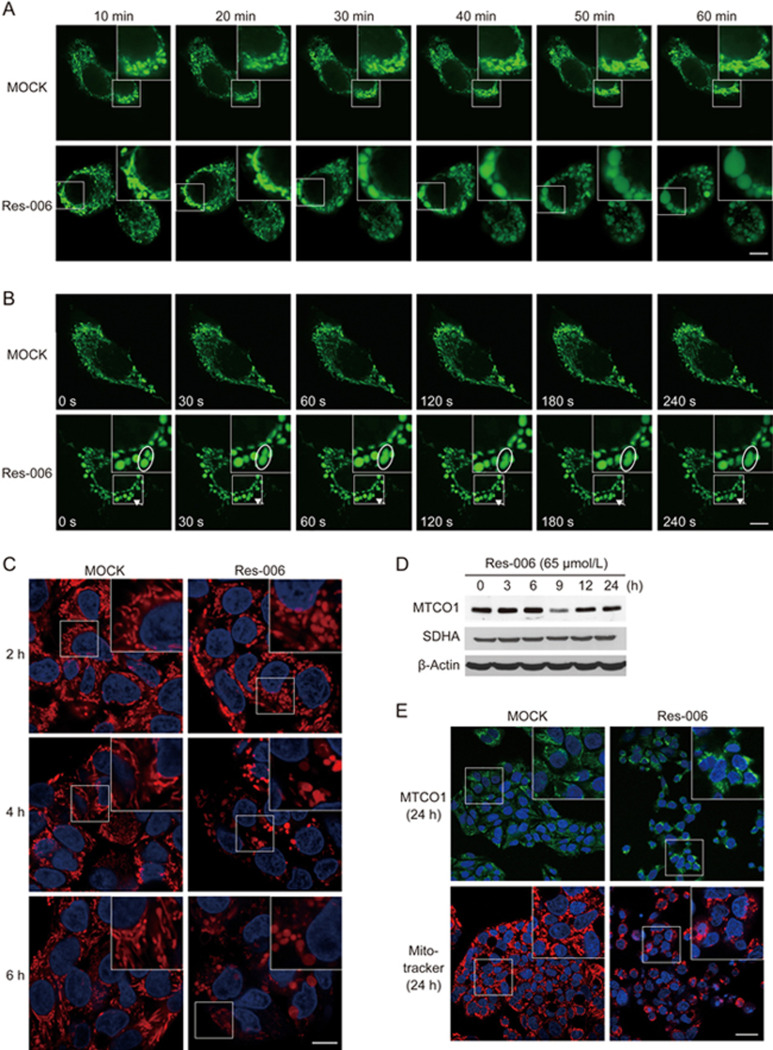
Figure 3.
Res-006 dysregulates mitochondrial dynamics and disrupts MMP in HepG2 cells. (A and B) HepG2 cells transfected with a Mito-EYFP-expressing plasmid (pEYFP-Mito) were treated with Res-006 (65 μmol/L), and the mitochondrial dynamics were analyzed by confocal fluorescence microscopy at the designated times. The scale bar denotes 10 μm. Inset shows a magnified view of the area outlined in the white lined box. The ovals in (B) outline mitochondria that are in the process of fusing. (C) HepG2 cells were stained with Hoechst 33258 (blue fluorescence, 2.5 μg/mL) and MitoTracker Red (200 nmol/L) after treatment with Res-006 (65 μmol/L) and were analyzed by confocal fluorescence microscopy at the indicated times. The scale bar denotes 10 μm. Inset shows a magnified view of the area outlined in the white lined box. (D) HepG2 cells were treated with Res-006 (65 μmol/L). Total cellular extracts were prepared and analyzed using Western blotting for MTCO1 (mitochondrially encoded cytochrome c oxidase I), SDHA (succinate dehydrogenase complex, subunit A), and β-actin. (E) HepG2 cells were stained with Hoechst 33258 (blue fluorescence) and anti-MTCO1 antibodies (green fluorescence) or Hoechst 33258 and MitoTracker Red after Res-006 treatment for 24 h and analyzed by confocal fluorescence microscopy. The scale bar denotes 30 μm. Inset shows a magnified view of the area outlined in the white lined box.

