
FIGURE 5.
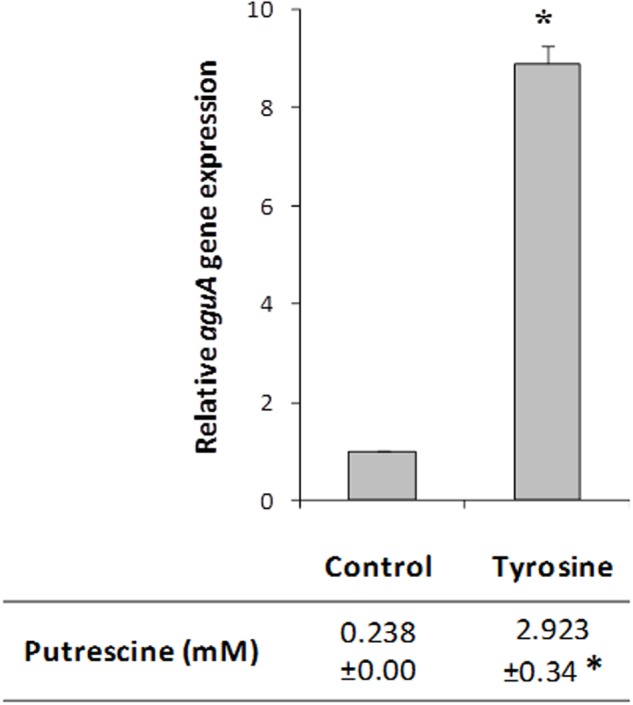
Effect of tyrosine on aguA expression (representing the whole aguBDAC operon) and putrescine production in E. faecalis. Cells were grown in GM17 supplemented with 5 mM agmatine (Control), 5 mM agmatine and 15 mM tyrosine. Gene expression was measured by RT-qPCR; putrescine accumulation was determined by UHPLC. The lowest expression level (Control) was used as the reference condition. Asterisks indicate significant differences with respect to the Control condition (∗p < 0.01, Student’s t-test).