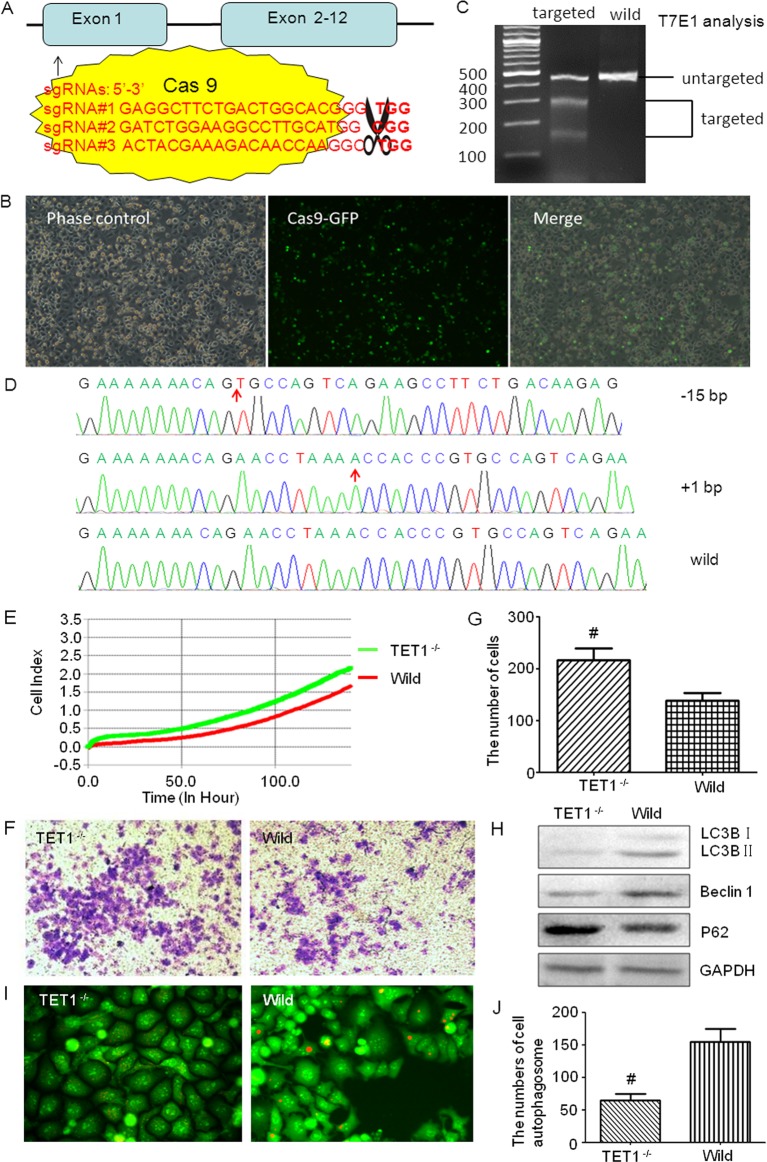
Figure 2. TET1 CRISPR/Cas9 plasmid construction and the effects of TET1 knockdown on U251 cells.
CRISPR/Cas9 mediated TET1 gene targeting in U251 cells and the effects of TET1 knockdown on U251 cells. (A) Diagrammatic sketch of TET1 and its target site by CRISPR/Cas9 plasmids. (B) Fluorescence microscopic observation of the transfection efficiency of CRISPR/Cas9 plasmids. Cells with green fluorescence were positively transfected ones. (C) CRISPR/Cas9 targeting detection. After two rounds of targeting by CRISPR/Cas9, the target sites of TET1 were amplified by PCR and then digested by T7E1 to evaluate the proportion of the mutated TET1. (D) Sequencing of TET1 for the selected cell clone after two rounds of targeting by CRISPR/Cas9. (E) xCELLigence RTCA detection was used to test the cell viability. Green one is the TET1−/− group and the red one represents the wild-type group (P<0.05). (F,G) Transwell tests the invasion ability of TET1−/− and wild-type cells. The Crystal Violet staining positive cells were those that passed through the Matrigel and Transwell (F). These cells were counted under an inverted microscope, and the numbers were shown in the histogram (G). (H) Western blot detected the level of autophagy in different groups. LC3B, Beclin 1 and P62 were detected. (I,J) Acridine Orange staining detected the autophagosomes in TET1−/− and wild-type U251 cells. The orange fluorescence presents the autophagosomes (I); and the numbers of autophagosomes were shown in the histogram (J); *P<0.05.

