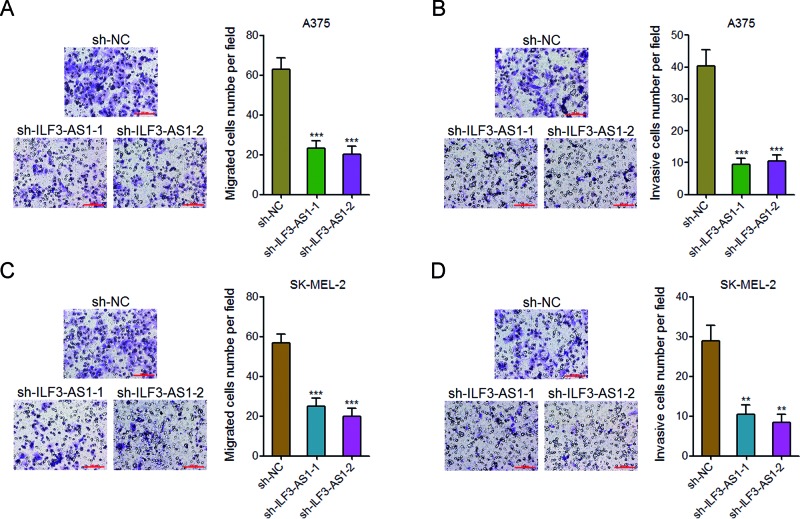
Figure 3. Knockdown of ILF3-AS1 inhibits melanoma cell migration and invasion.
(A) Transwell migration assays in ILF3-AS1 stably depleted and control A375 cells. Representative images are shown; scale bar = 100 μm. (B) Transwell invasion assays in ILF3-AS1 stably depleted and control A375 cells. Representative images are shown; scale bar = 100 μm. (C) Transwell migration assays in ILF3-AS1 stably depleted and control SK-MEL-2 cells. Representative images are shown; scale bar = 100 μm. (D) Transwell invasion assays in ILF3-AS1 stably depleted and control SK-MEL-2 cells. Representative images are shown; scale bar = 100 μm. For all panels, data are represented as mean ± SD; **P<0.01, ***P<0.001 by Student’s t test.

