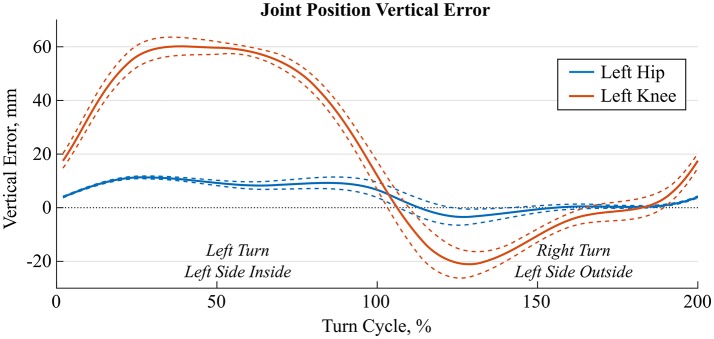
Figure 4.
Average (solid lines) ± 1 standard deviation (dashed lines) of time-normalized hip (blue) and knee (orange) joint position errors along the vertical Y-axis for 9 left and right turns of a representative trial. The first 100% of the turn cycle is a left turn where the left leg is the inside leg and the second 100% is a right turn where the left leg is the outside leg.

