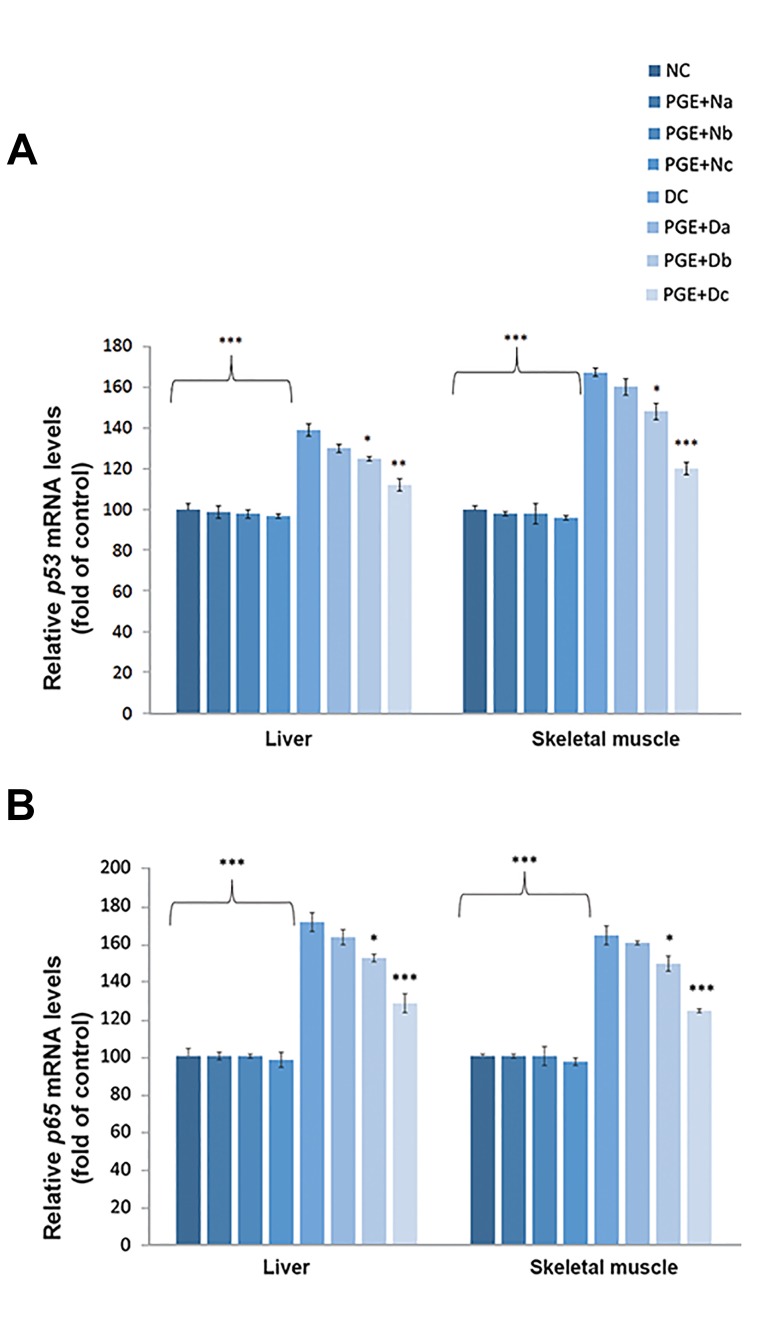
Fig.3.
Quantitative real-time polymerase chain reaction analysis of the inflammatory transcription factors. The levels of the A. p53 and B. p65 were measured in the liver and skeletal muscle tissues of non-diabetic control group (NC, n=12), non-diabetic group treated with 100, 200, or 350 mg/kg body weight (bw) of pomegranate fruit aqueous extract [PGE+N (a, b, c); n=12], diabetic control group (DC, n=12), and diabetic group treated with 100, 200, or 350 mg/kg bw of PGE [PGE+D (a, b, c), n=12]. Results are expressed as fold of control. 18s RNA was used as an internal control (n=3). The mean of six independent experiments is shown. Significantly different from DC group, *; P<0.05, **; P<0.01, and ***; P<0.001.

