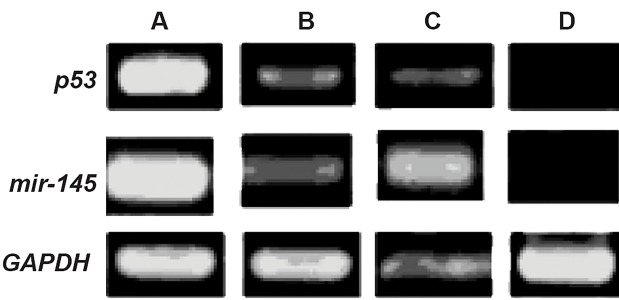
Fig.4.
Analysis of p53 and miR-145 expressions by reverse transcription PCR in A, B, C, and D groups. A; Fresh CD34+ cells, B; CD34+ cells cultured in the presence of cytokines, C; CD34+ cells indirectly cultured on feeder layer, and D; CD34+ cells directly cultured on feeder layer. GAPDH group was considered the control group.

