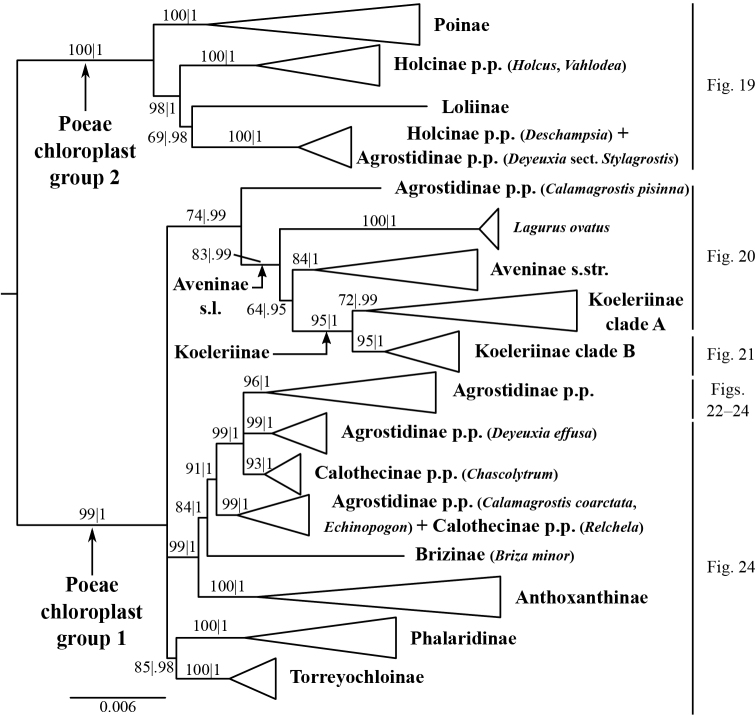
Figure 3.
Overview of the maximum likelihood phylogram inferred from combined plastid data (atpF–atpH, psbK–psbI, psbA–rps19–trnH, matK, trnL–trnF). Major clades in the complete tree are collapsed. The corresponding figures showing details of subsections of the tree are indicated. ML bootstrap support (left) and BI poster probabilities (right) are recorded along branches. No support is shown for branches with bootstrap support <50% and posterior probability <.5. The ML tree is presented in its entirety in Suppl. material 6.

